



When a buyer contacted an agent through Zillow, fewer than half got a response. I was the sole designer on the multi-year initiative that took connection rates from under 50% to over 90%.
90%+of buyer contacts connected with an agent within a year, up from under 50%
18%+survey completion, against a 5% goal
~10%higher customer satisfaction across Zillow Group brands
Overview
That was the problem. When a home buyer contacted an agent through Zillow, there was less than a 50% chance they’d get a response. We validated it by analyzing contact submissions across the site.
What would be a win?
100% connection between qualified buyers and agents.
My role and team
Sole product designer, working with 5 PMs and 3 engineering teams, one of them in San Francisco.
Phase 1
Renters and unqualified redirected to Zillow
A research study uncovered why it was happening.
Leads arrived when agents couldn’t answer, and busy agents had no easy way to pause their advertising.
Agents judged leads by home value, neighborhood or name. Sometimes that was blatant discrimination, which we wanted to end.
Ignoring a lead cost an agent almost nothing, while buyers blamed Zillow.
The data and research validated the problem. Next we needed the major stakeholders in one room to align, develop solutions and decide what to do. Our VP of Design led a three-day sprint with Zillow’s founders, SVPs, product leaders, research and analytics. The decision changed product roadmaps for years.
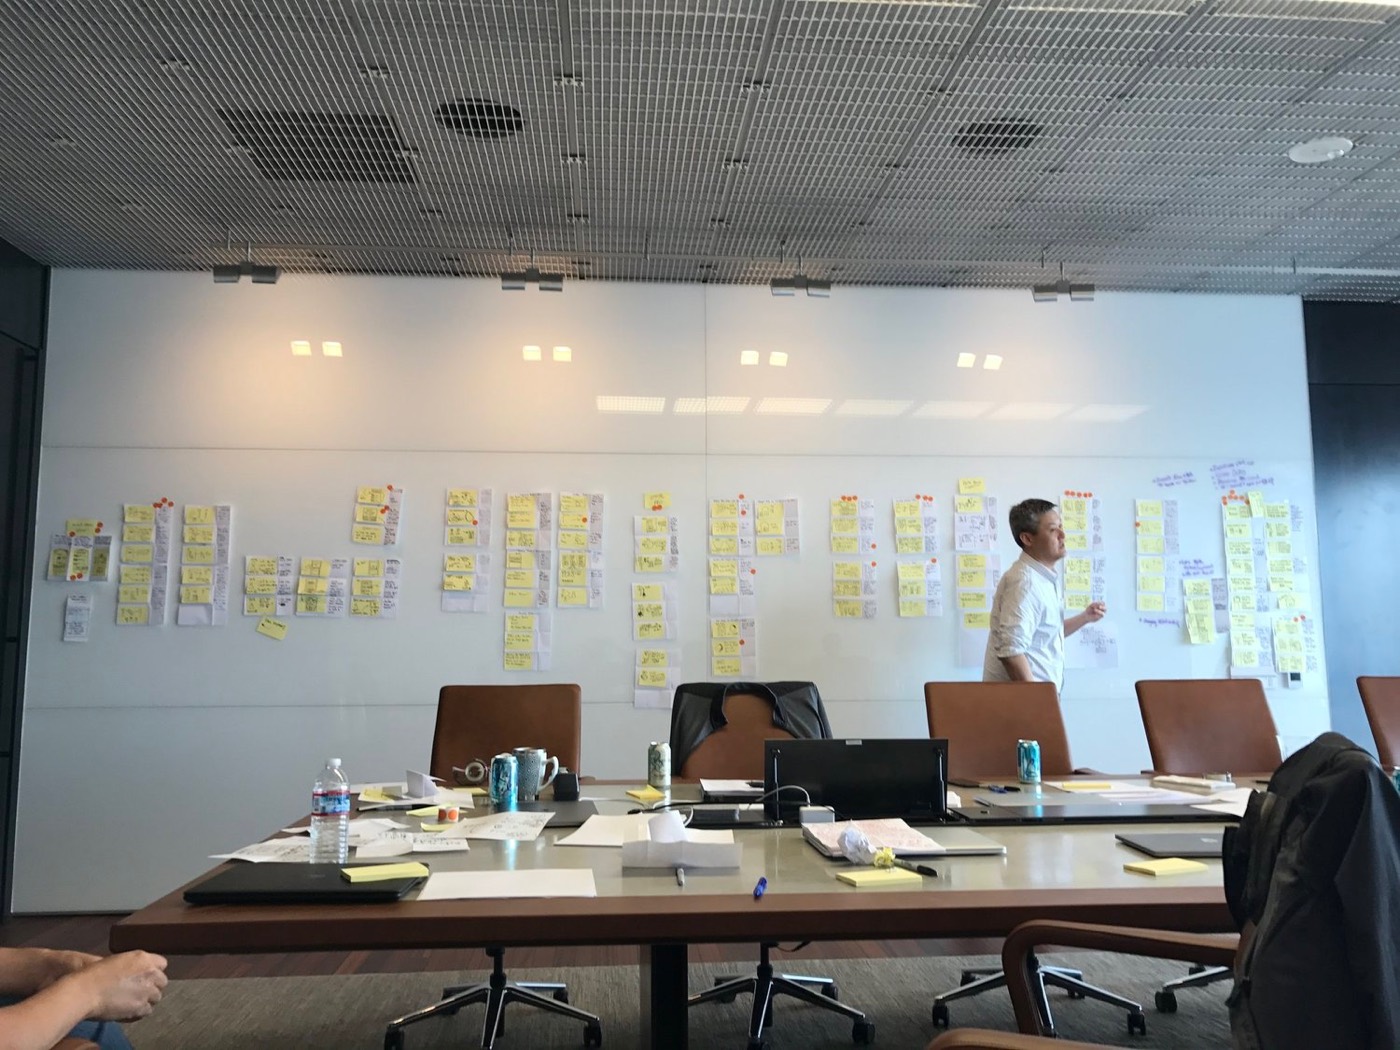
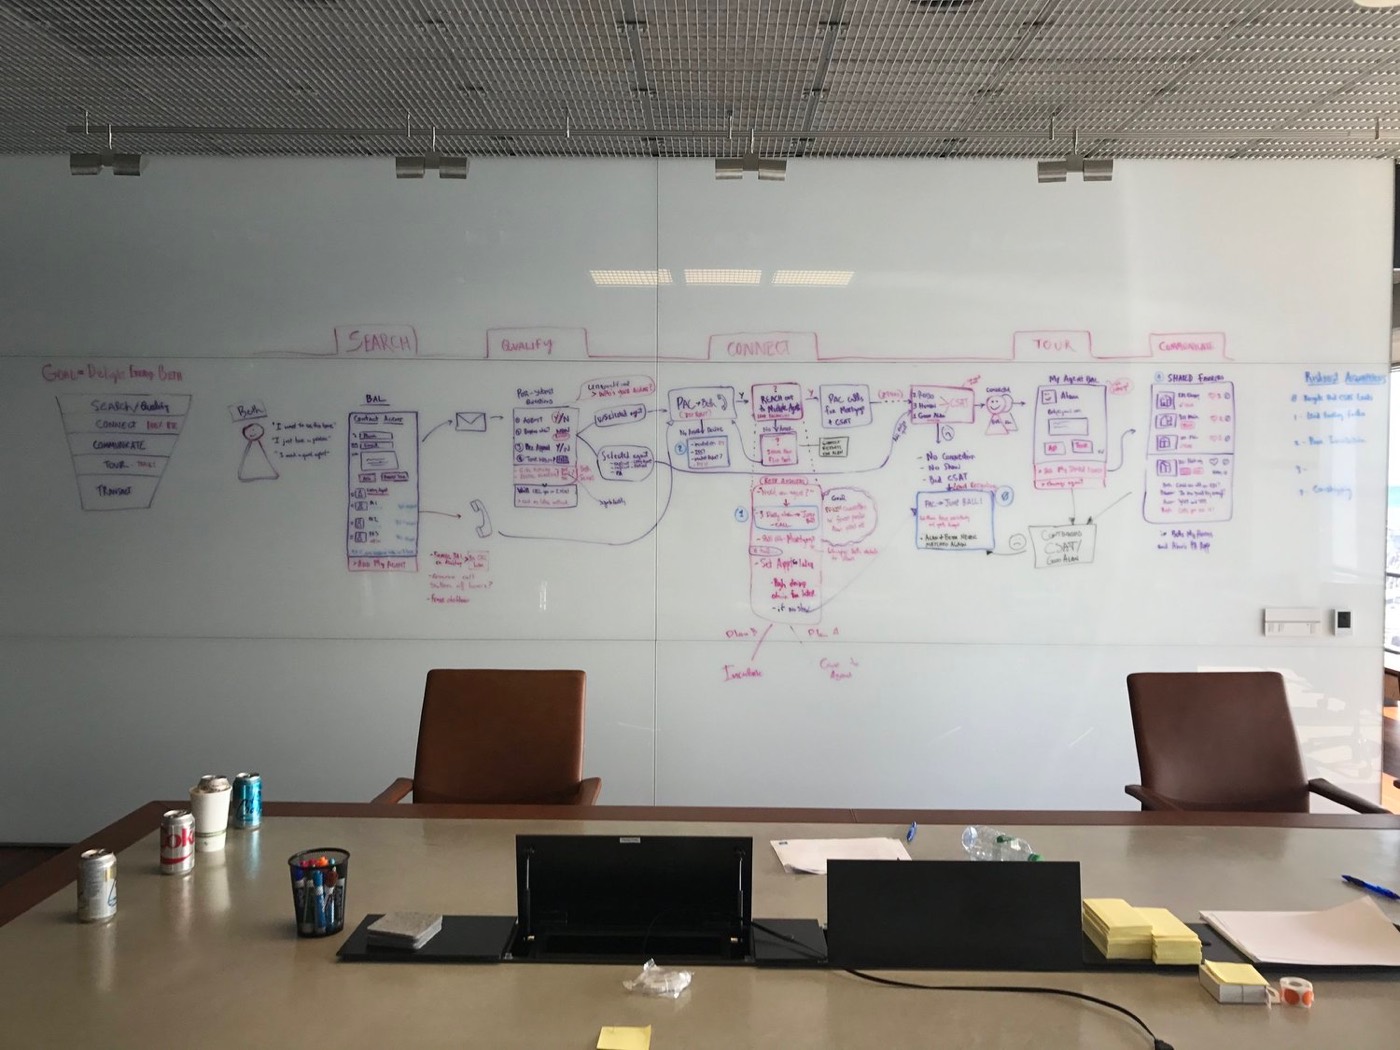
A new vision for how buyers and agents first interact, and how agents stay motivated to communicate, from qualifying buyers to touring homes together.
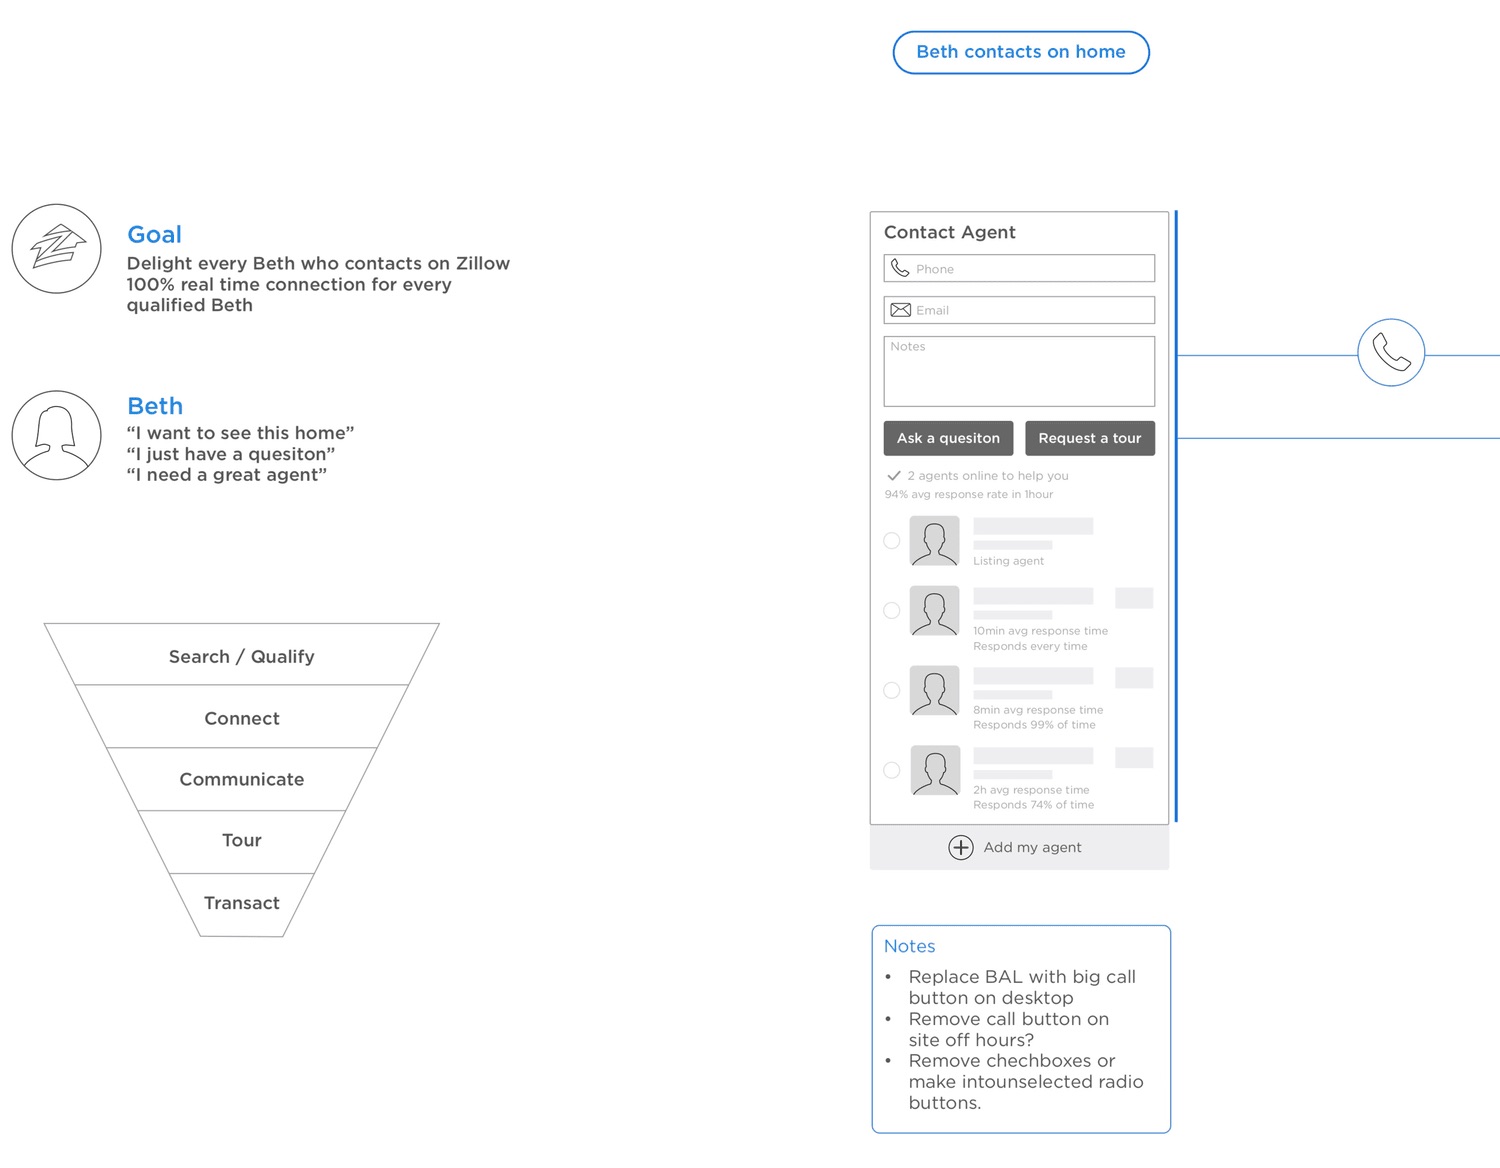
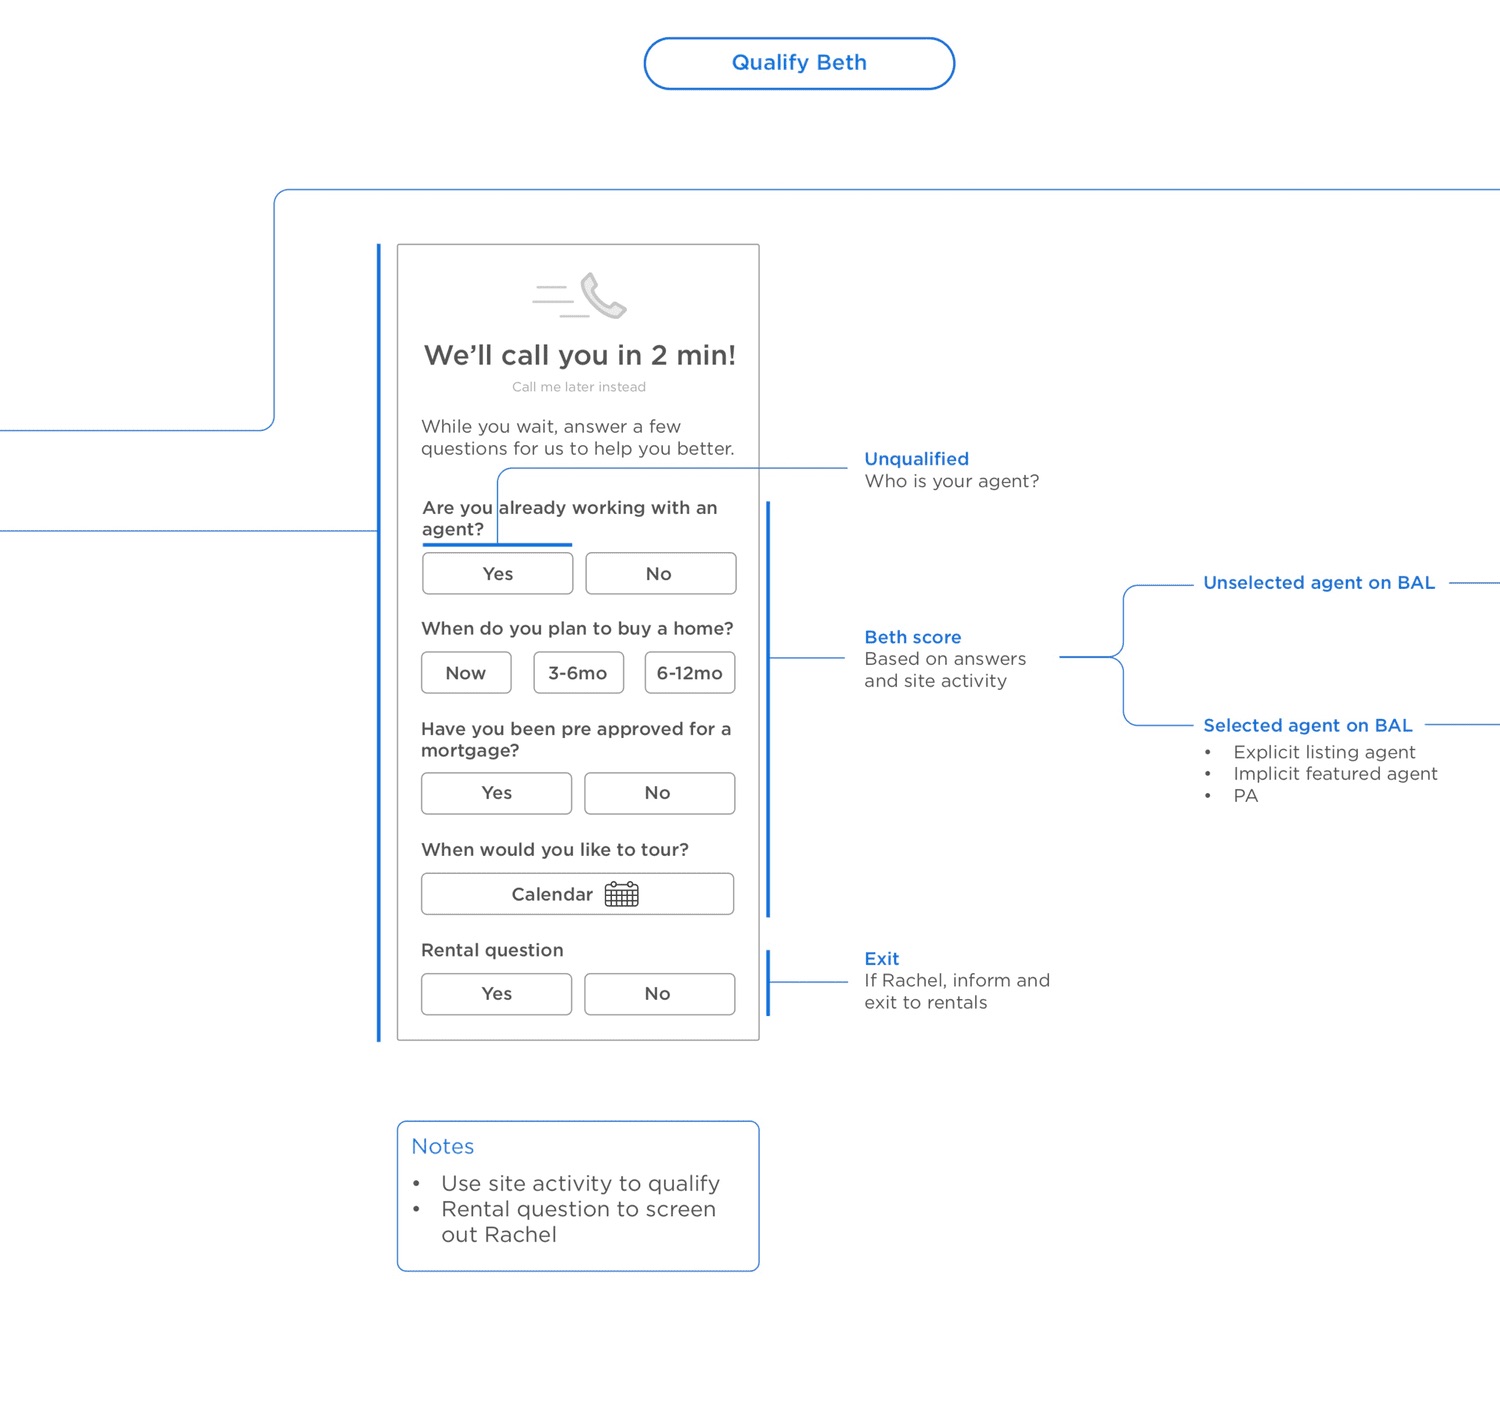
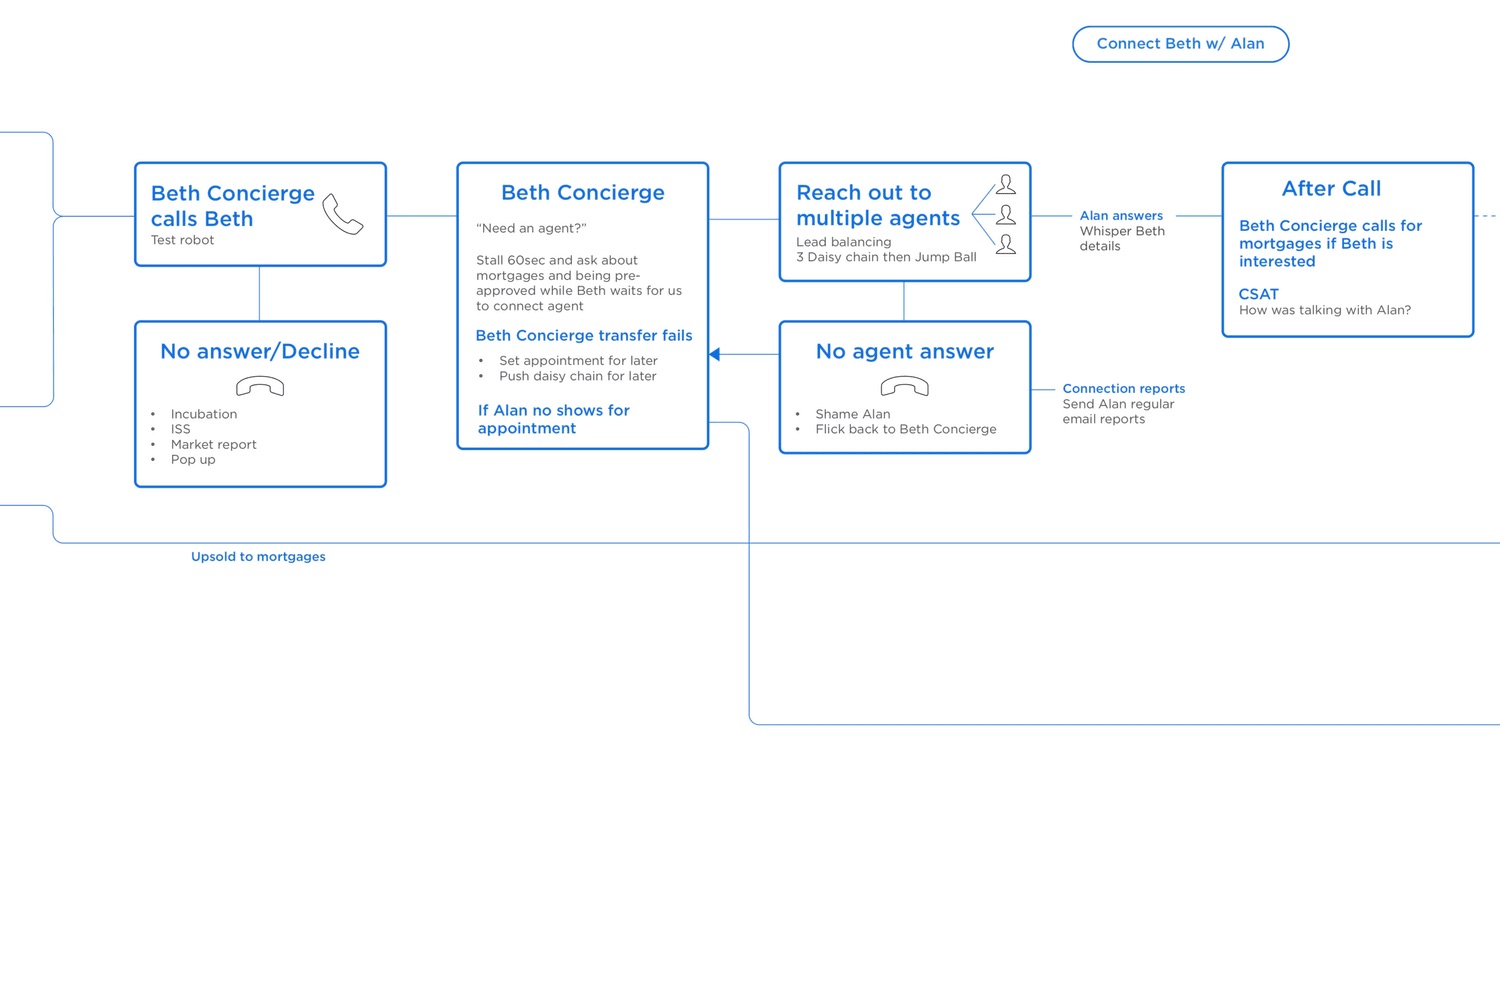
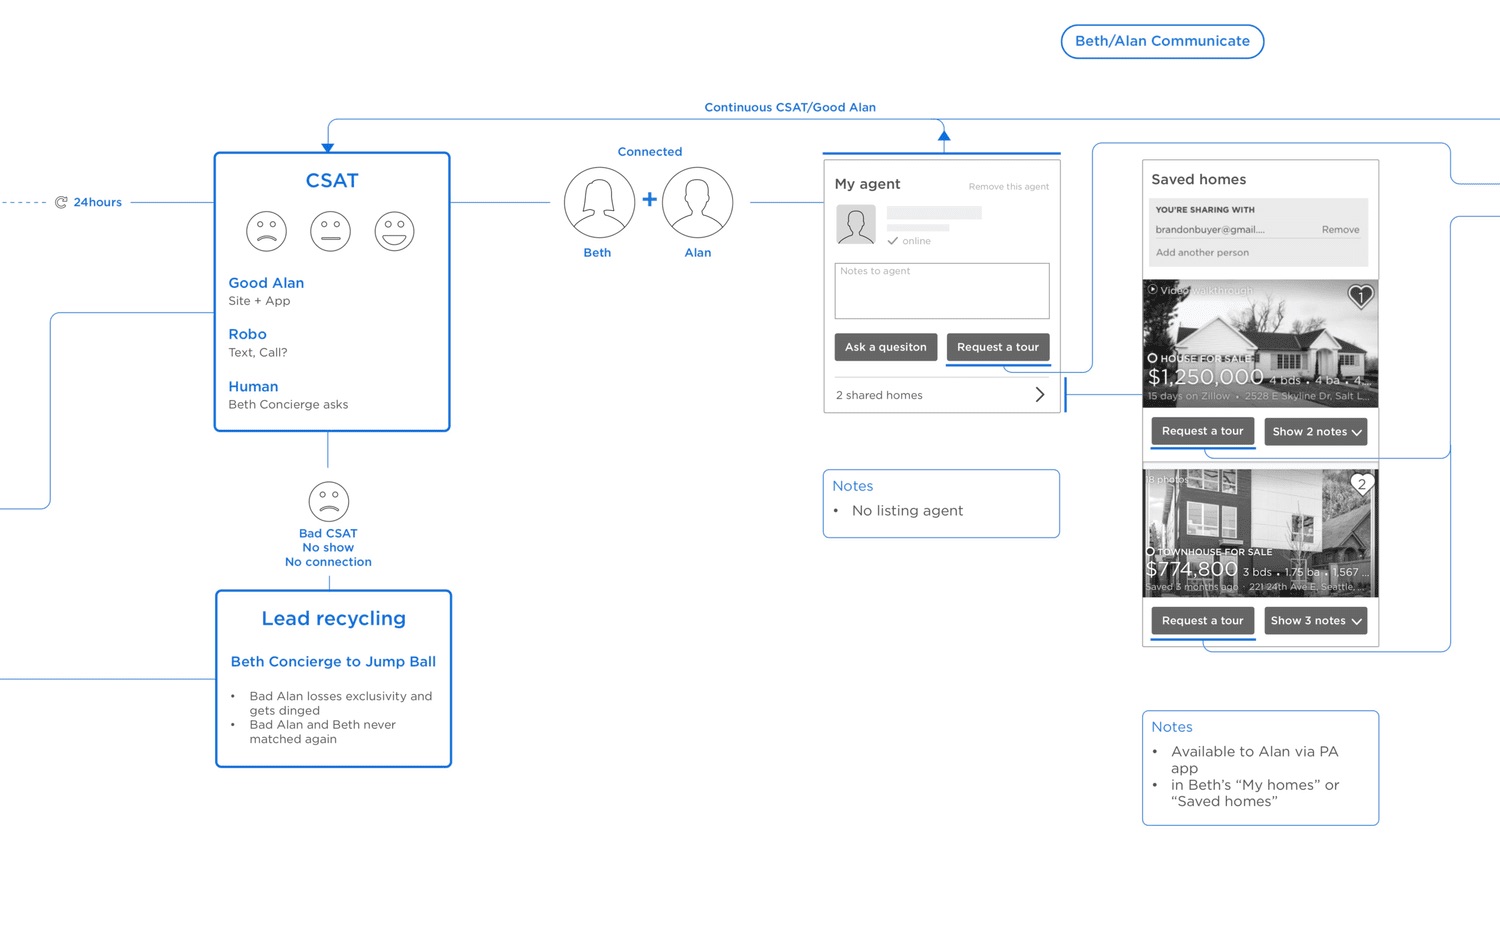
The journey we mapped at the end of the sprint. Beth is the buyer persona; Alan is the agent.
Phase 2
Hypothesis: agents will like being shown exclusively to buyers, in exchange for connecting and keeping a good relationship, scored by those buyers. And they won’t mind us gathering feedback from their clients, in exchange for private insight into how they’re perceived.
We chose storyboarding for its speed, and because it answered the basic questions we had about the concept.
Agents resoundingly approved, validating the hypothesis, and we made a few changes from their feedback. They asked for negative feedback not to be anonymous, so they could address it with the buyer. I didn’t carry that forward: it would have hurt buyers’ trust in Zillow.
Phase 3
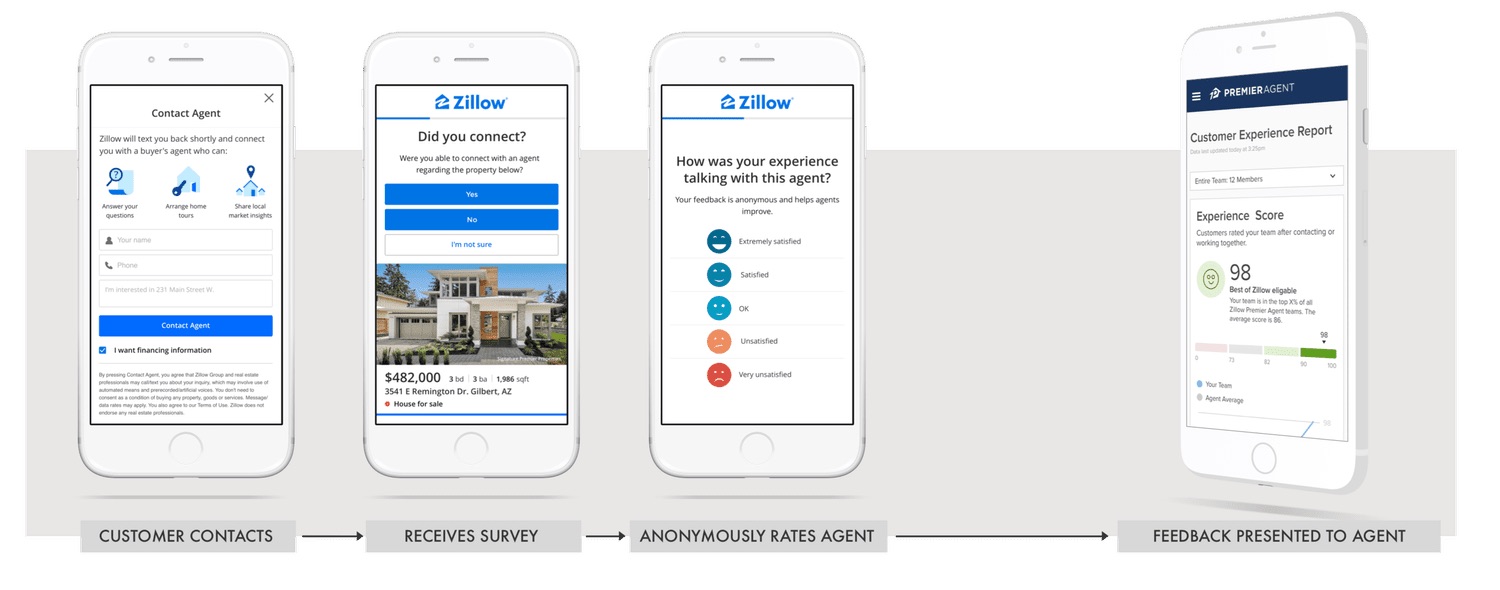
Research told us that with more information, agents could improve and be more accountable. We prompted buyers 24 hours after they contacted an agent: first on site, then by email, then by text, in order of intrusiveness.
Goal
Collect the most information with the least disruption, flexible across brands and questions.
What would be a win?
Over 5% survey completion, against a 1% baseline for our research surveys.
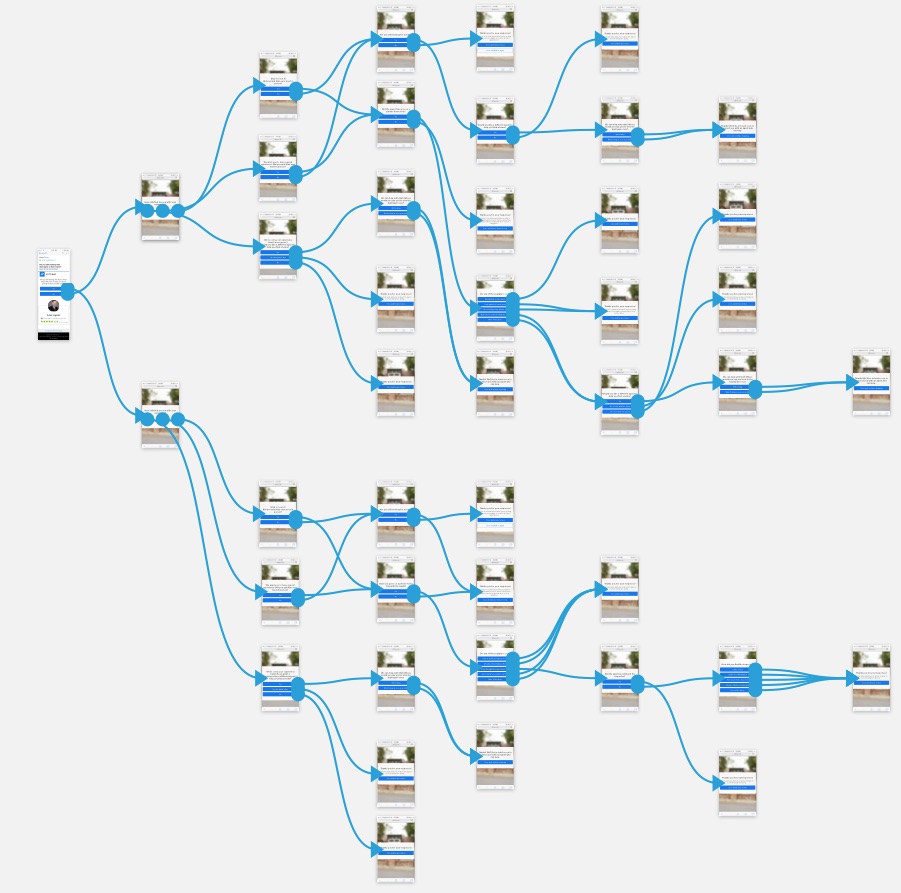
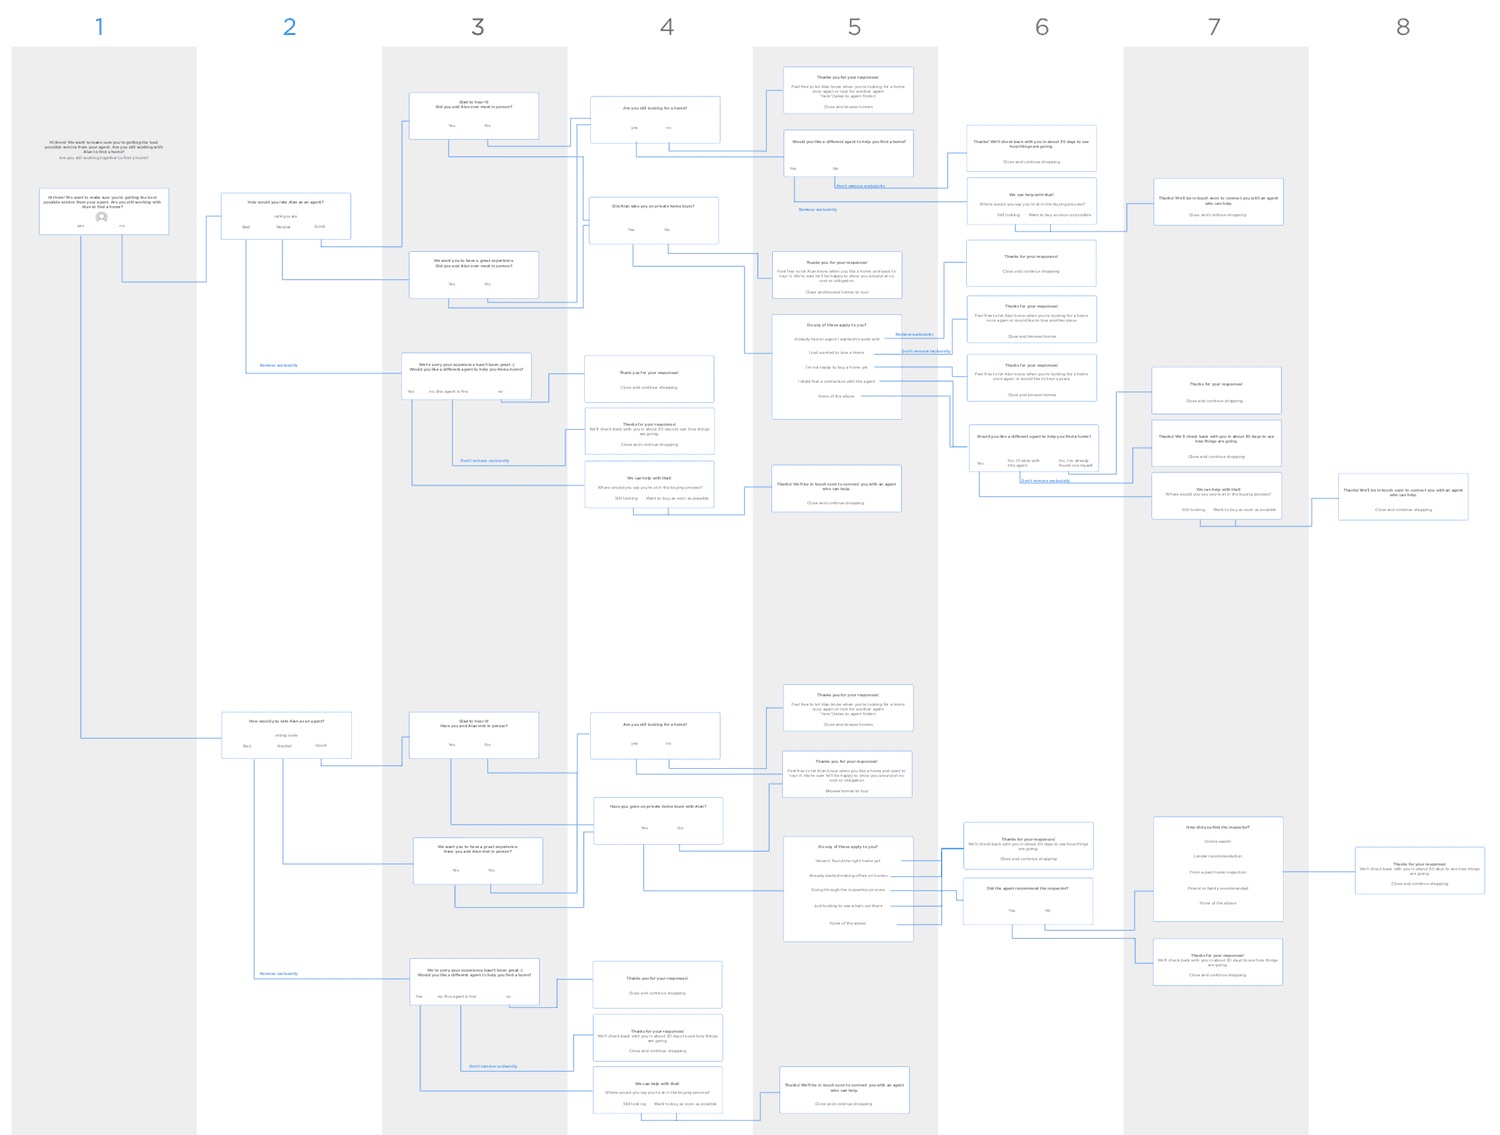
About five questions, written as a choose-your-own-adventure: a negative answer led to different follow-ups than a positive one.
We picked questions from data on what agents should be doing. A phone call made a transaction 300% more likely; setting up and touring a home, 30%.
A repeatable, flexible structure, as simple as possible for the MVP, that worked for every question and all four Zillow Group brands.
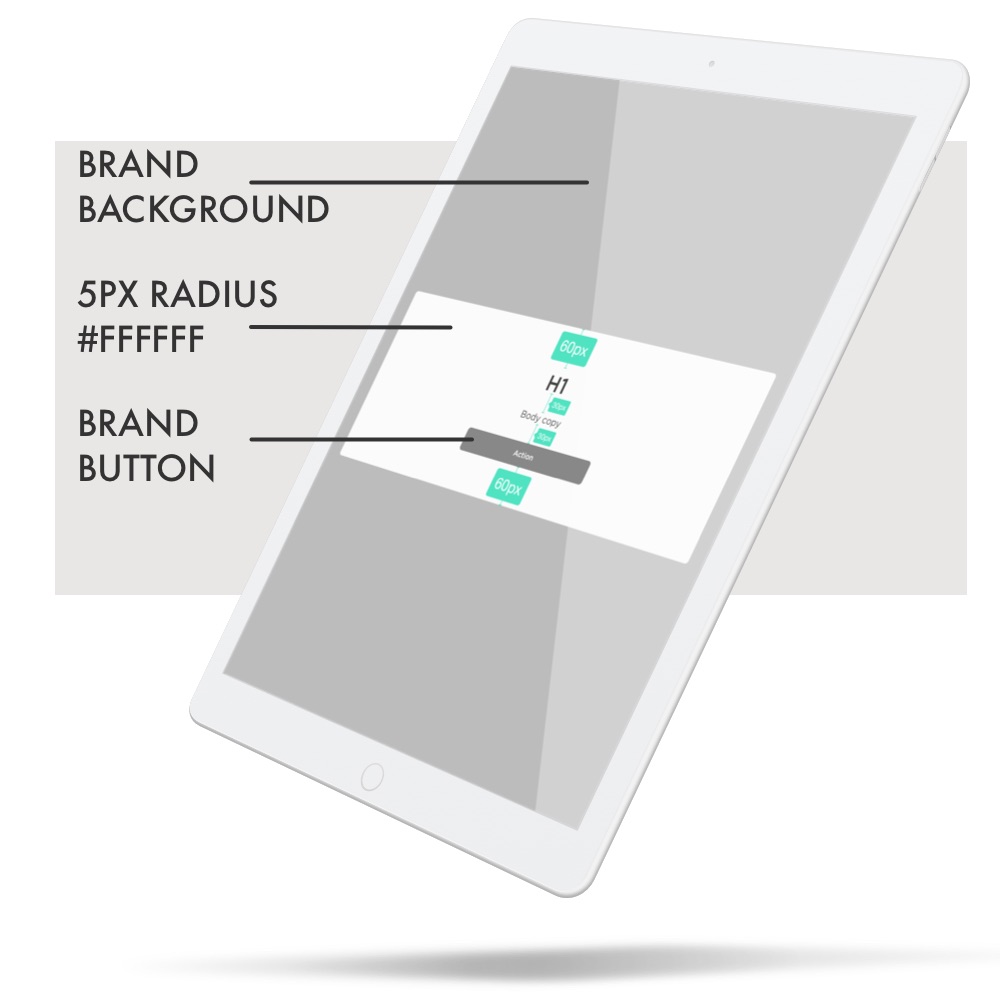
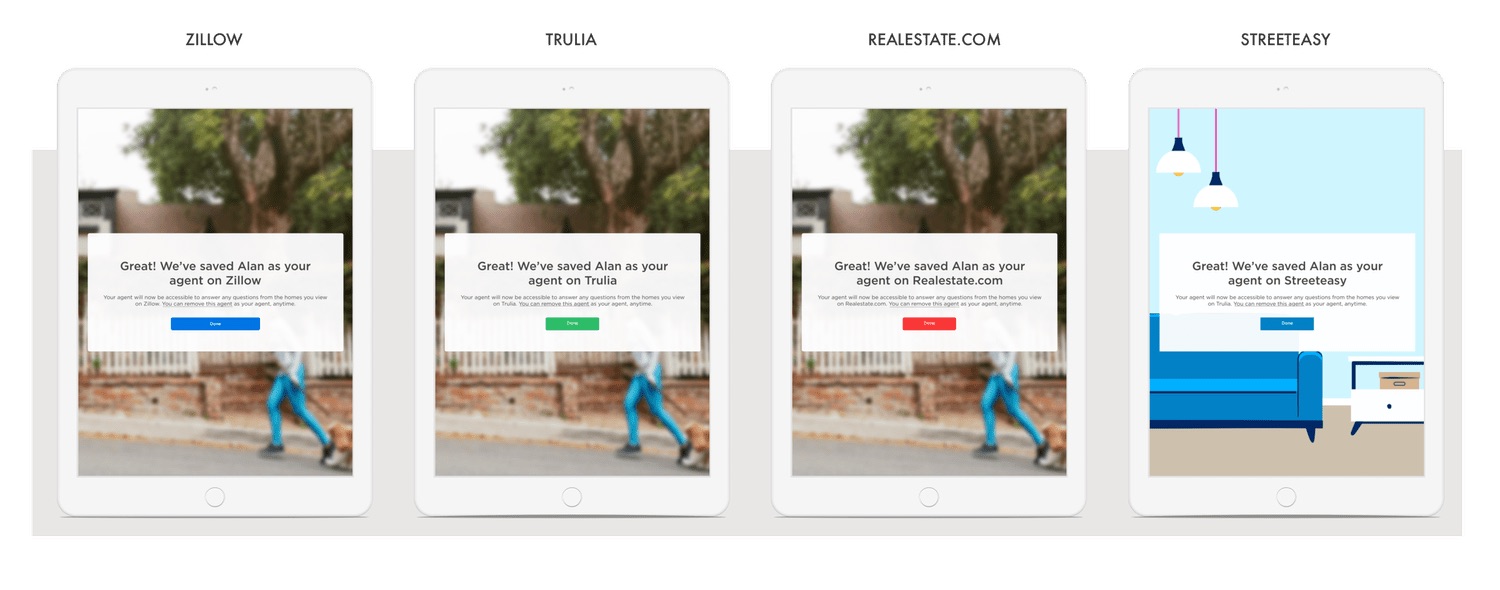
To push conversion further, I gathered what had worked for peers across Zillow Group: one question per slide, a progress bar, no navigation, no images or distractions.
The most contested decision. The business strongly wanted five stars; I leaned towards a three-point emotion scale. Research was inconclusive, so we launched stars, with a plan I agreed with the PM to switch if certain data showed up. A year later it did, and version 2 moved to emotions.
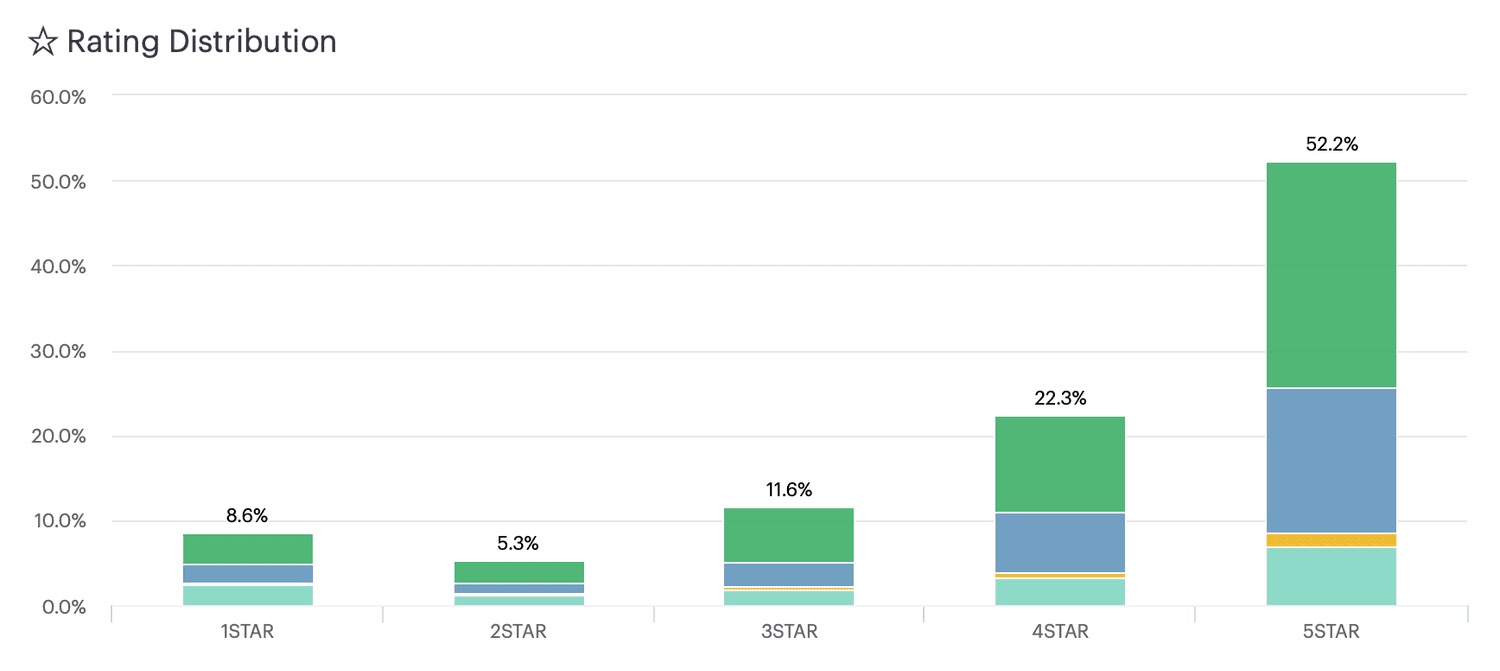
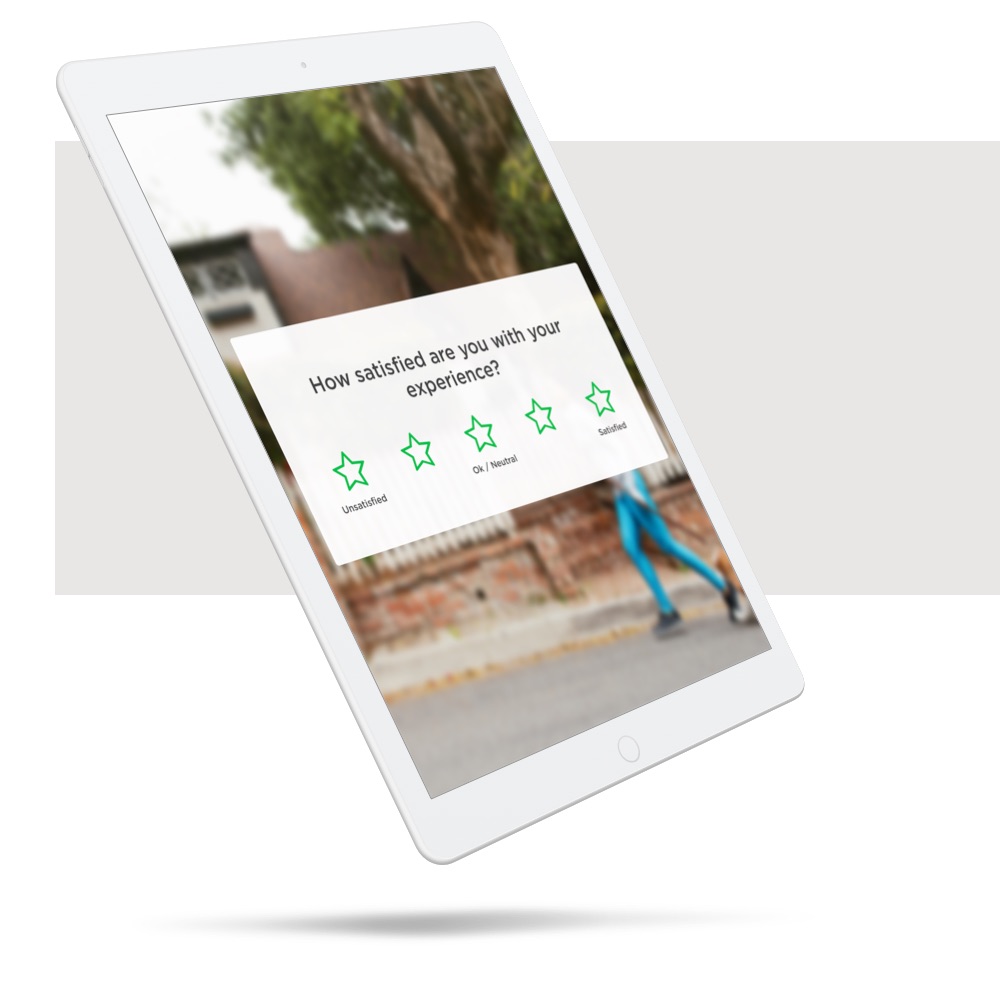
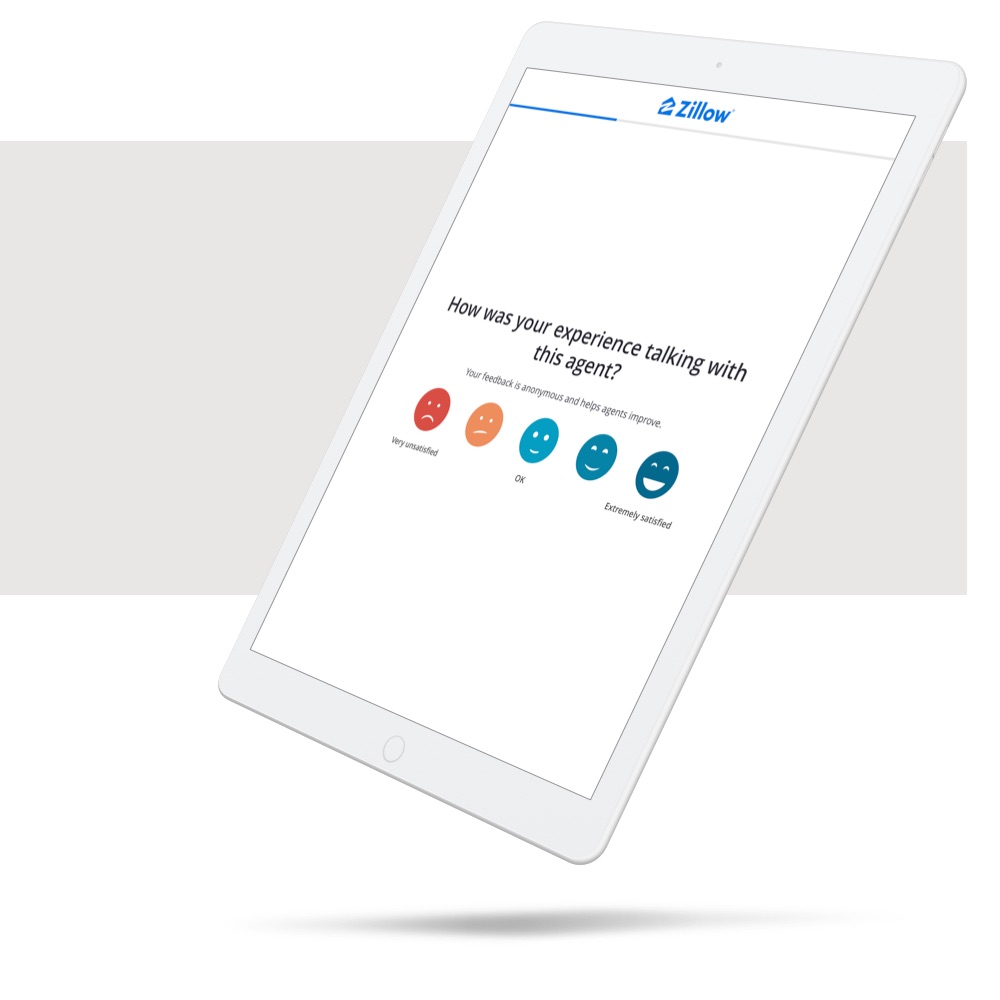
of buyers who received the survey completed it, against a 5% goal and a 1% research baseline. Millions of completed surveys now help agents improve.
The survey platform expanded to mortgages and new construction, and became a lightweight way for Zillow to test new ideas with users, with little extra design or engineering work, thanks to its flexible structure.
Phase 4
After about eight months of data, it was time to show it to agents: to celebrate great service, help others improve, and remove bad players.
What would be a win?
Showing the data leads agents to improve their overall score, as rated by buyers.
Letter grades made agents anxious, like being graded at school. They couldn’t focus on the rest of the page, so we removed grades.
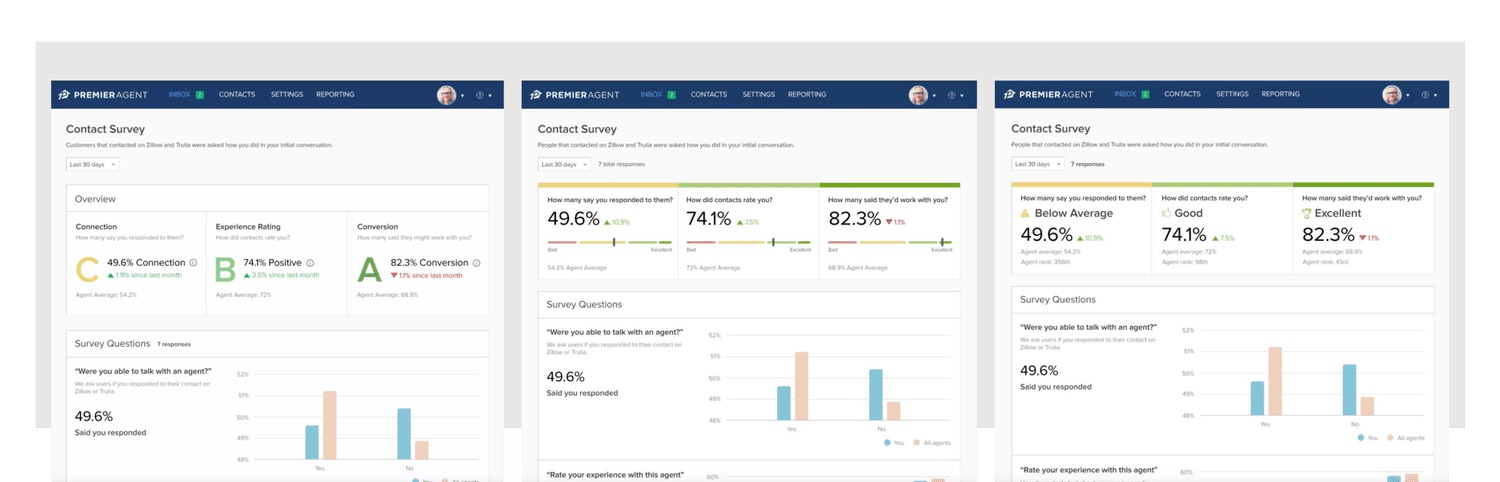
We learned, iterated and tested our way to the launched design. I worked with the design systems team on reusable components, with marketing and insights on education, and with engineering on a new approach to data visualization.
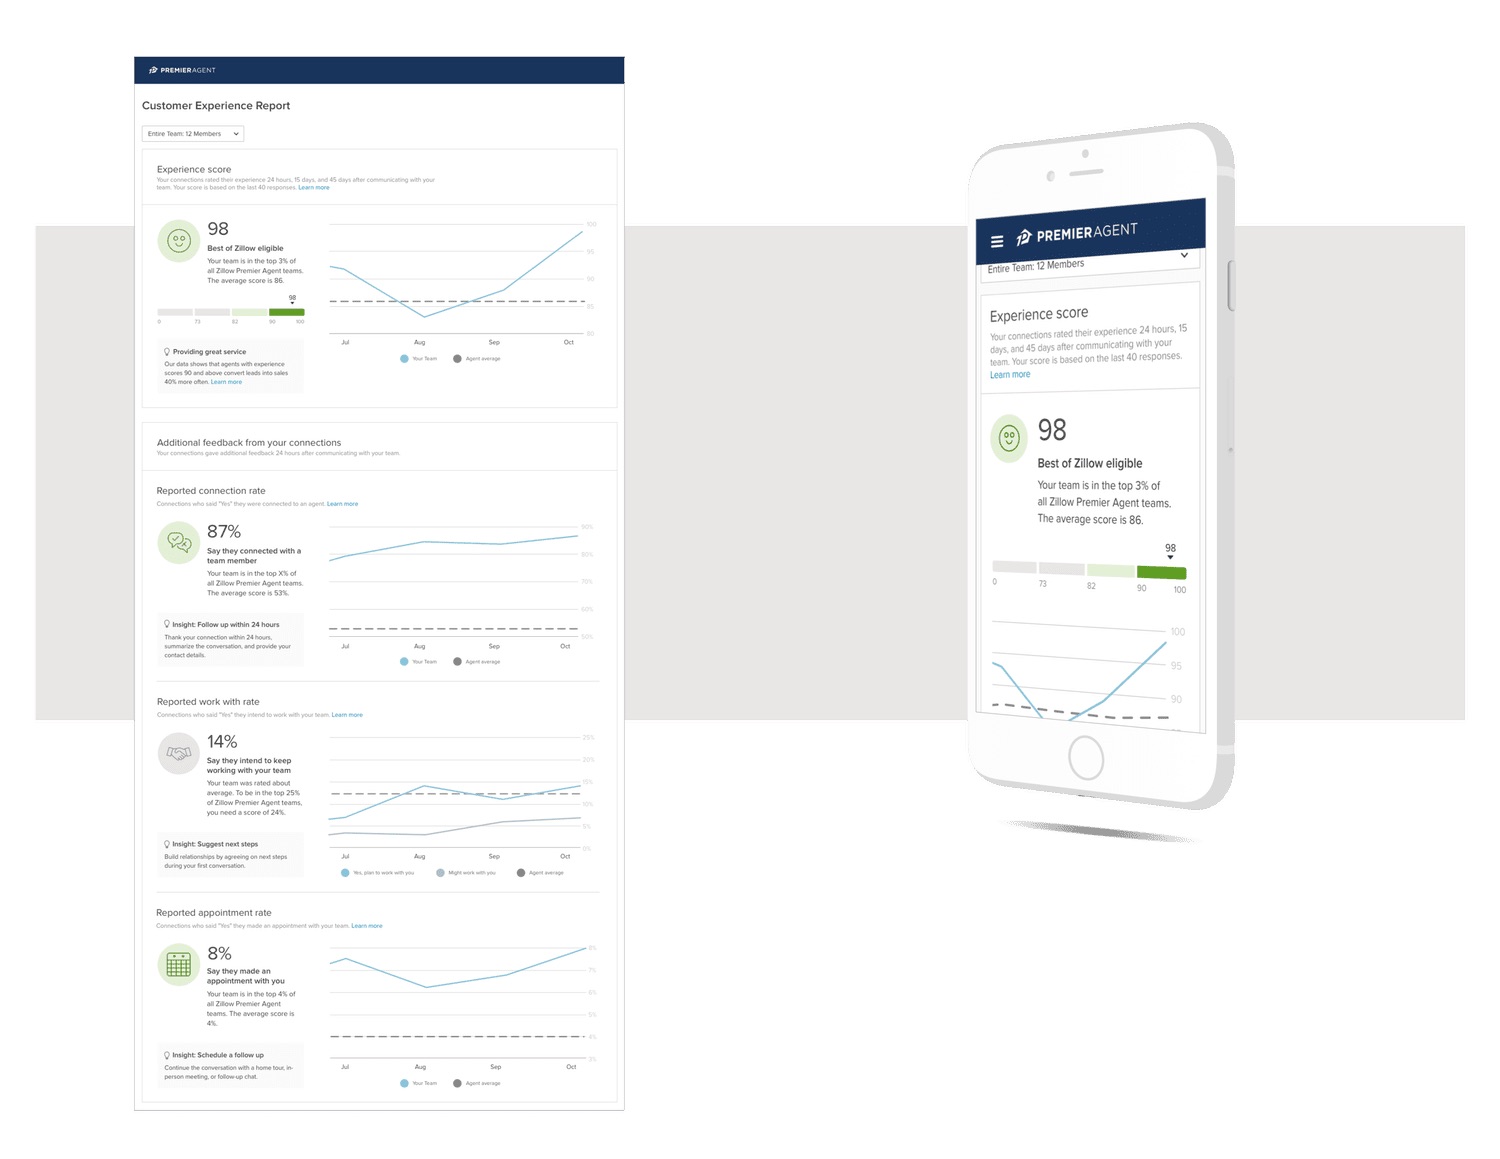
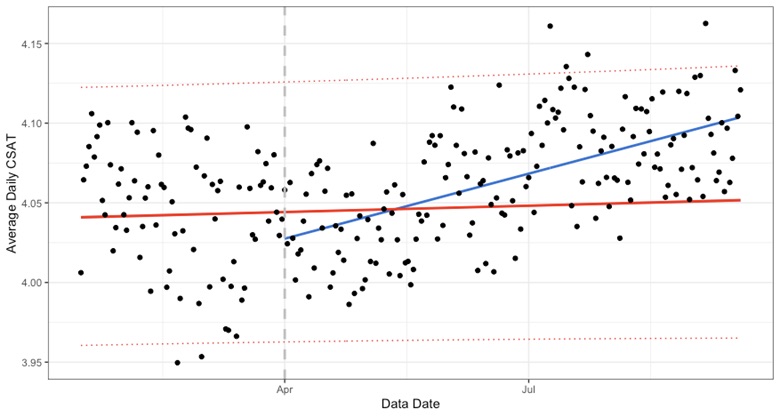
Agents improved their performance after launch. It let us reward great performers through the Best of Zillow program, educate low performers, and remove bad professionals after giving them time to improve.
Reception was impressively positive. We presented it at the annual Premier Agent Forum in Las Vegas.
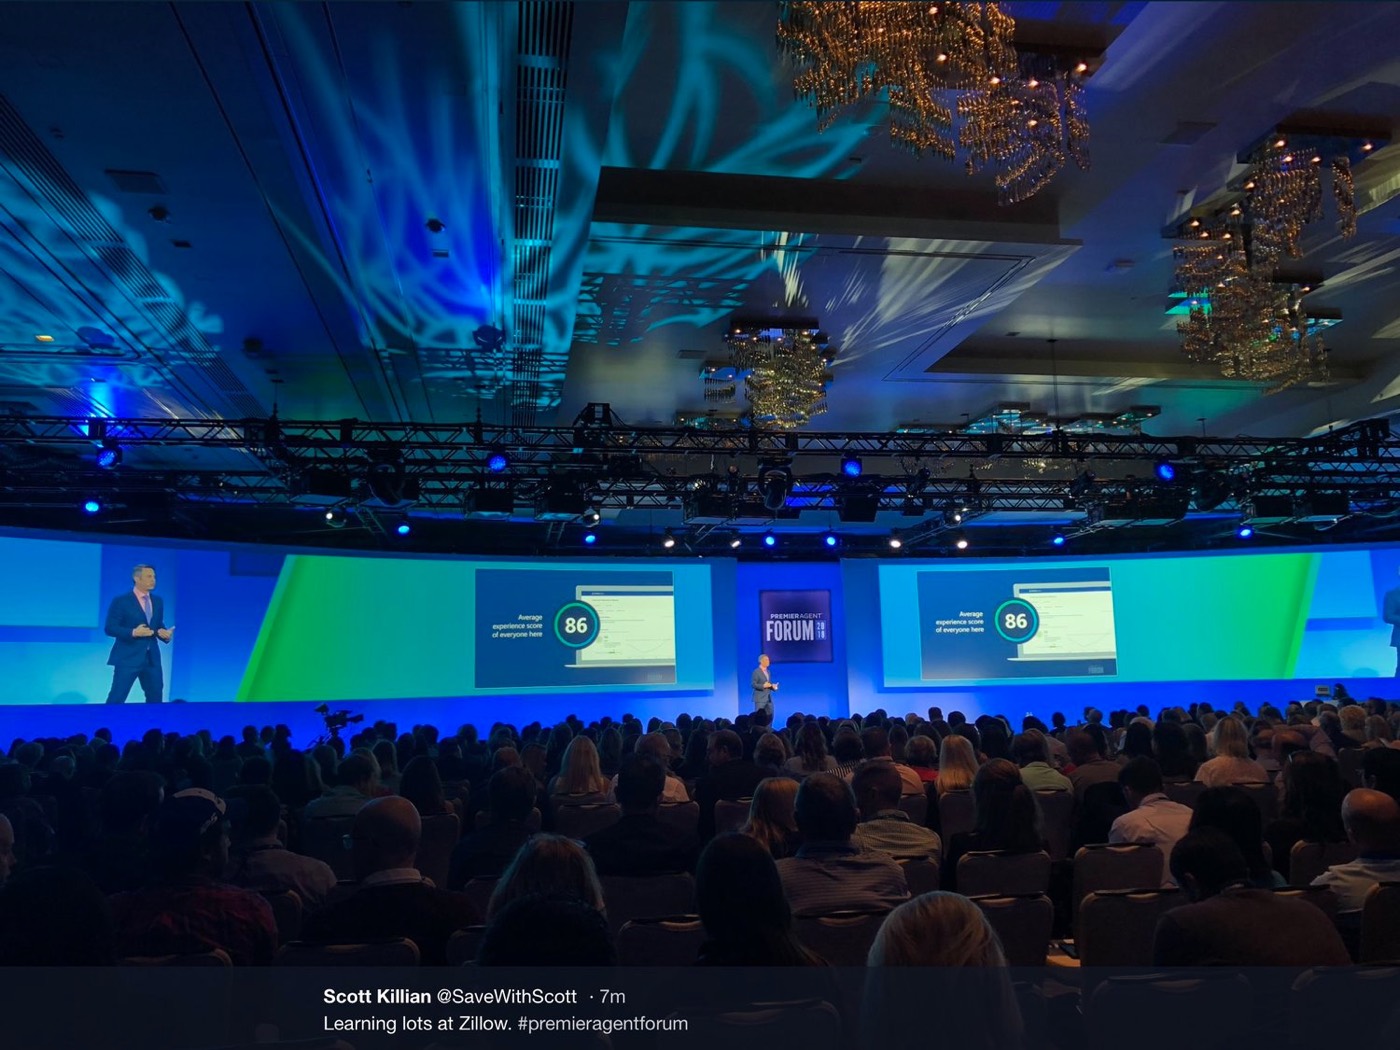
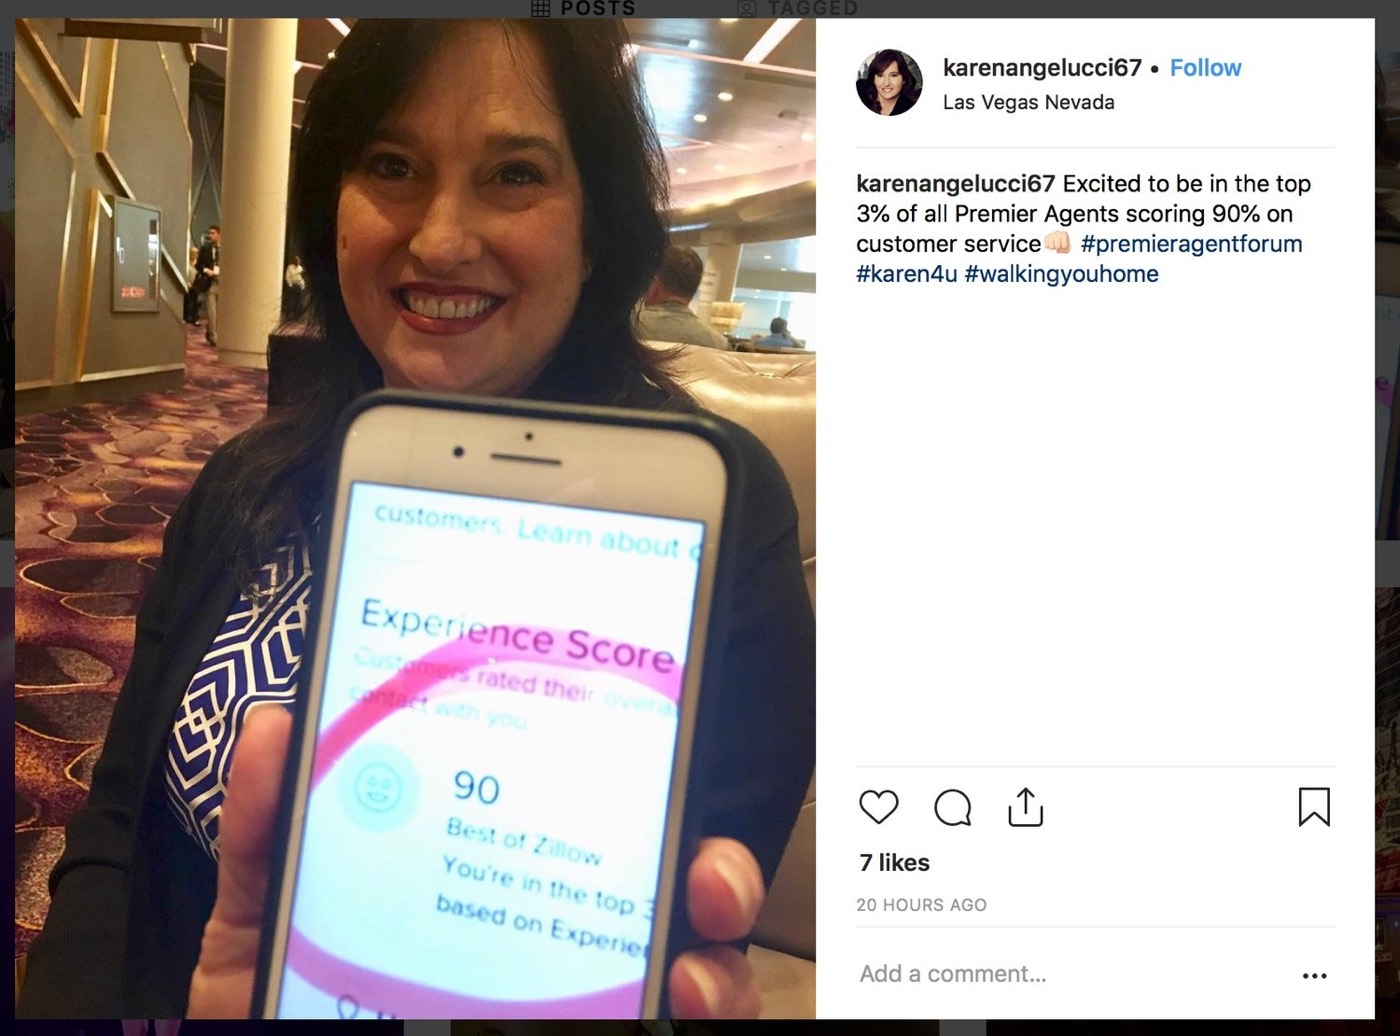
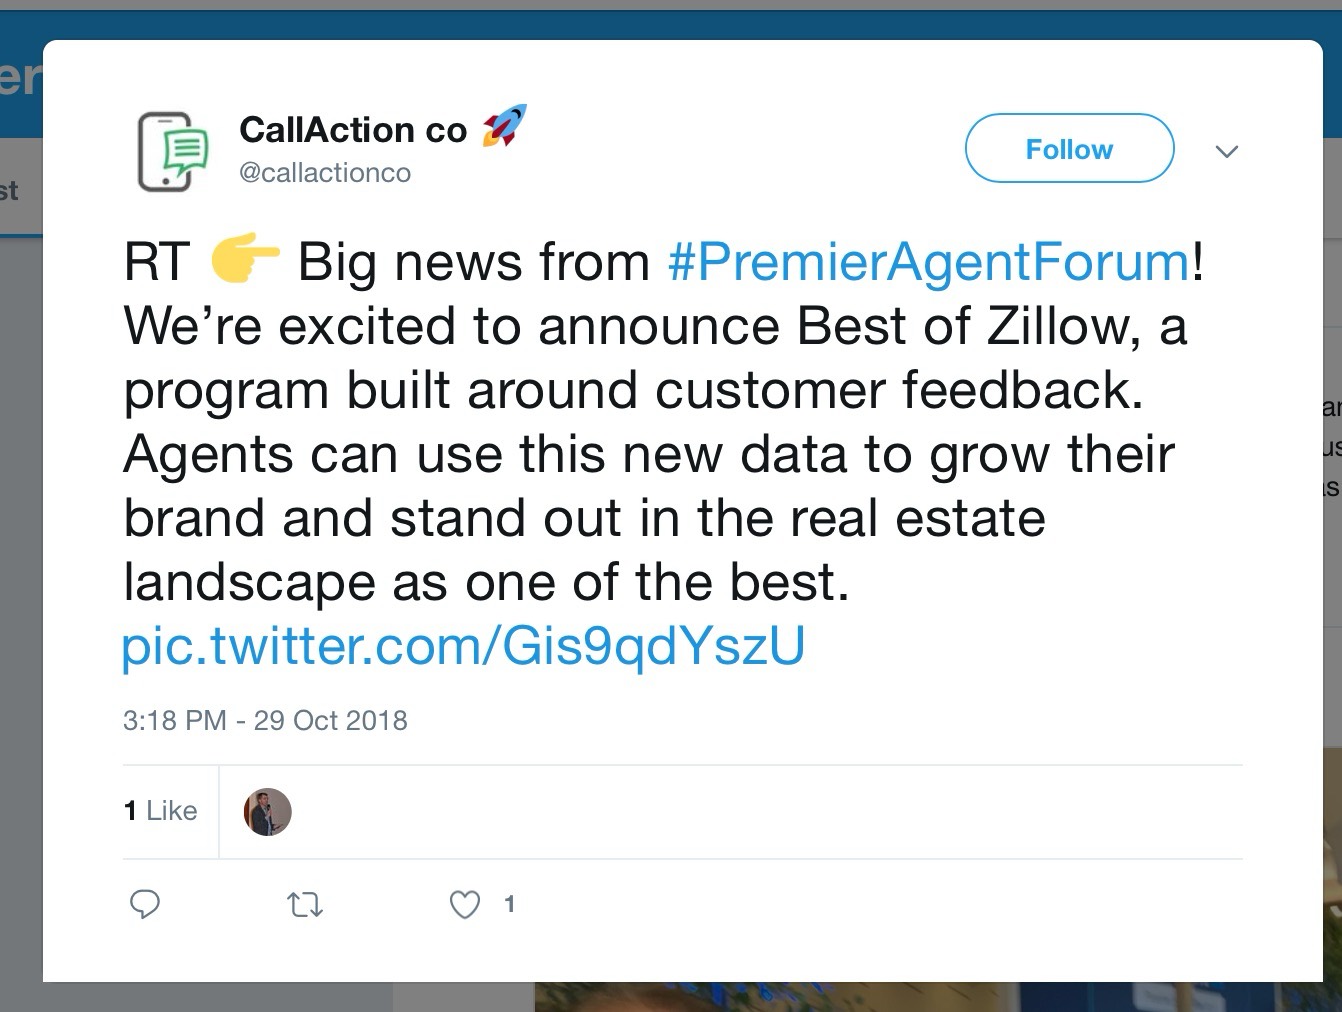
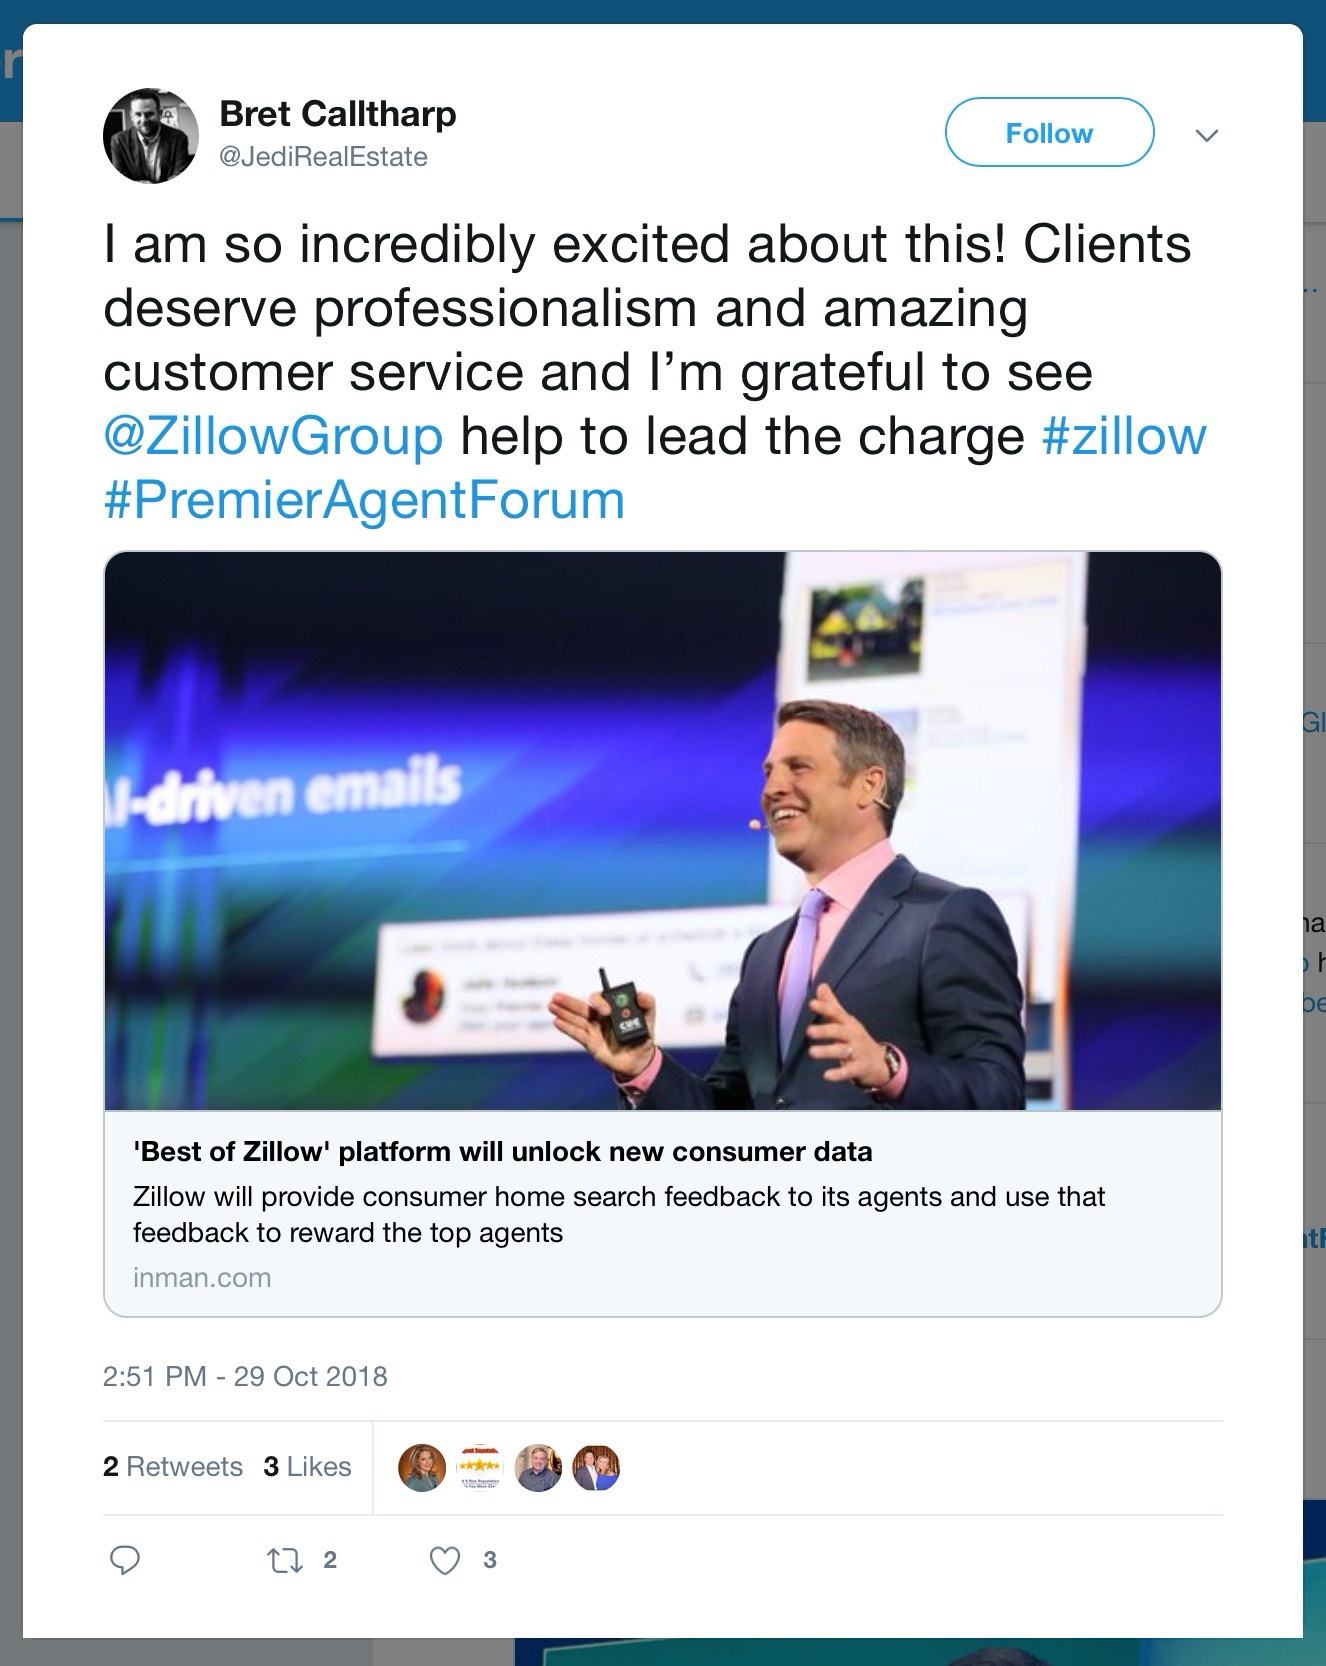
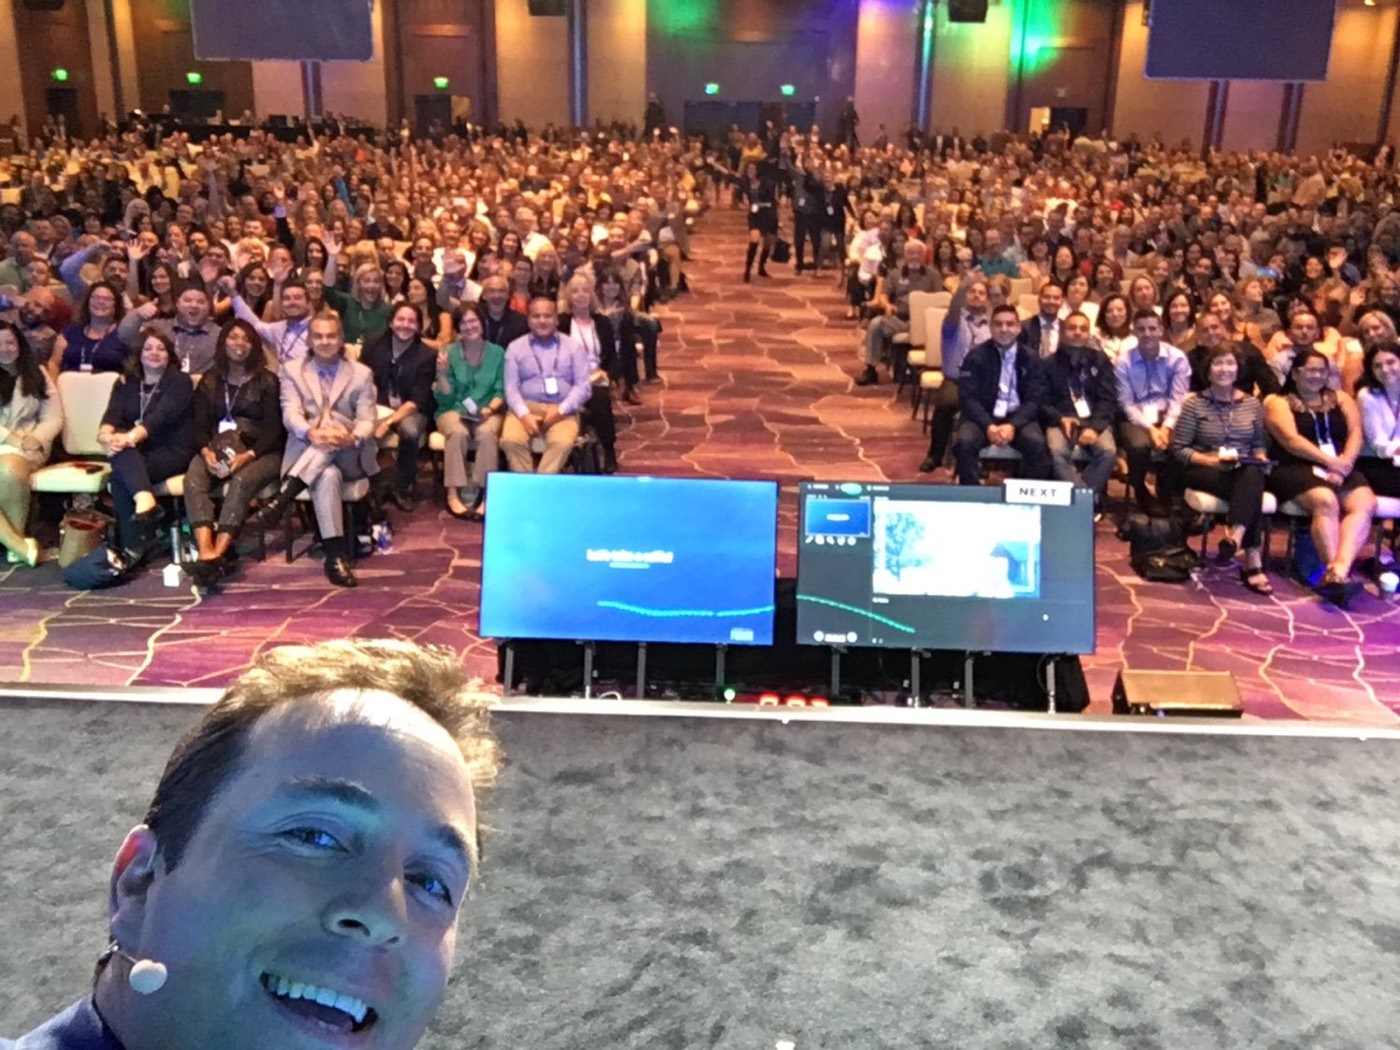
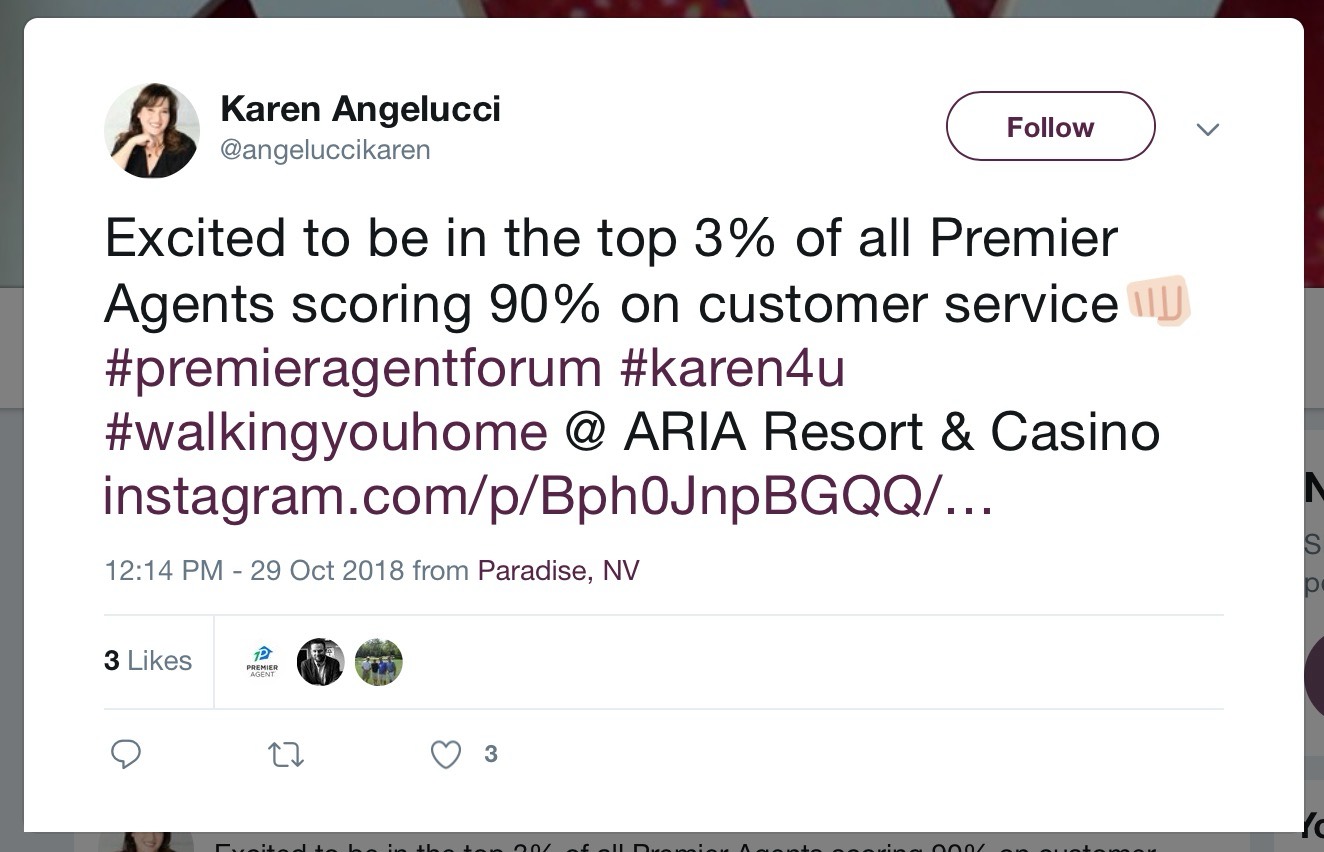
From the launch at the Premier Agent Forum, and what agents posted afterwards.
Conclusion
A whole development team was formed around this problem, and it continues to be iterated on. The metrics we give agents are some of the most valuable tools we produced: honest, anonymous insight into what they do well and how to improve. They’ve helped raise customer satisfaction across Zillow Group brands by about 10%.
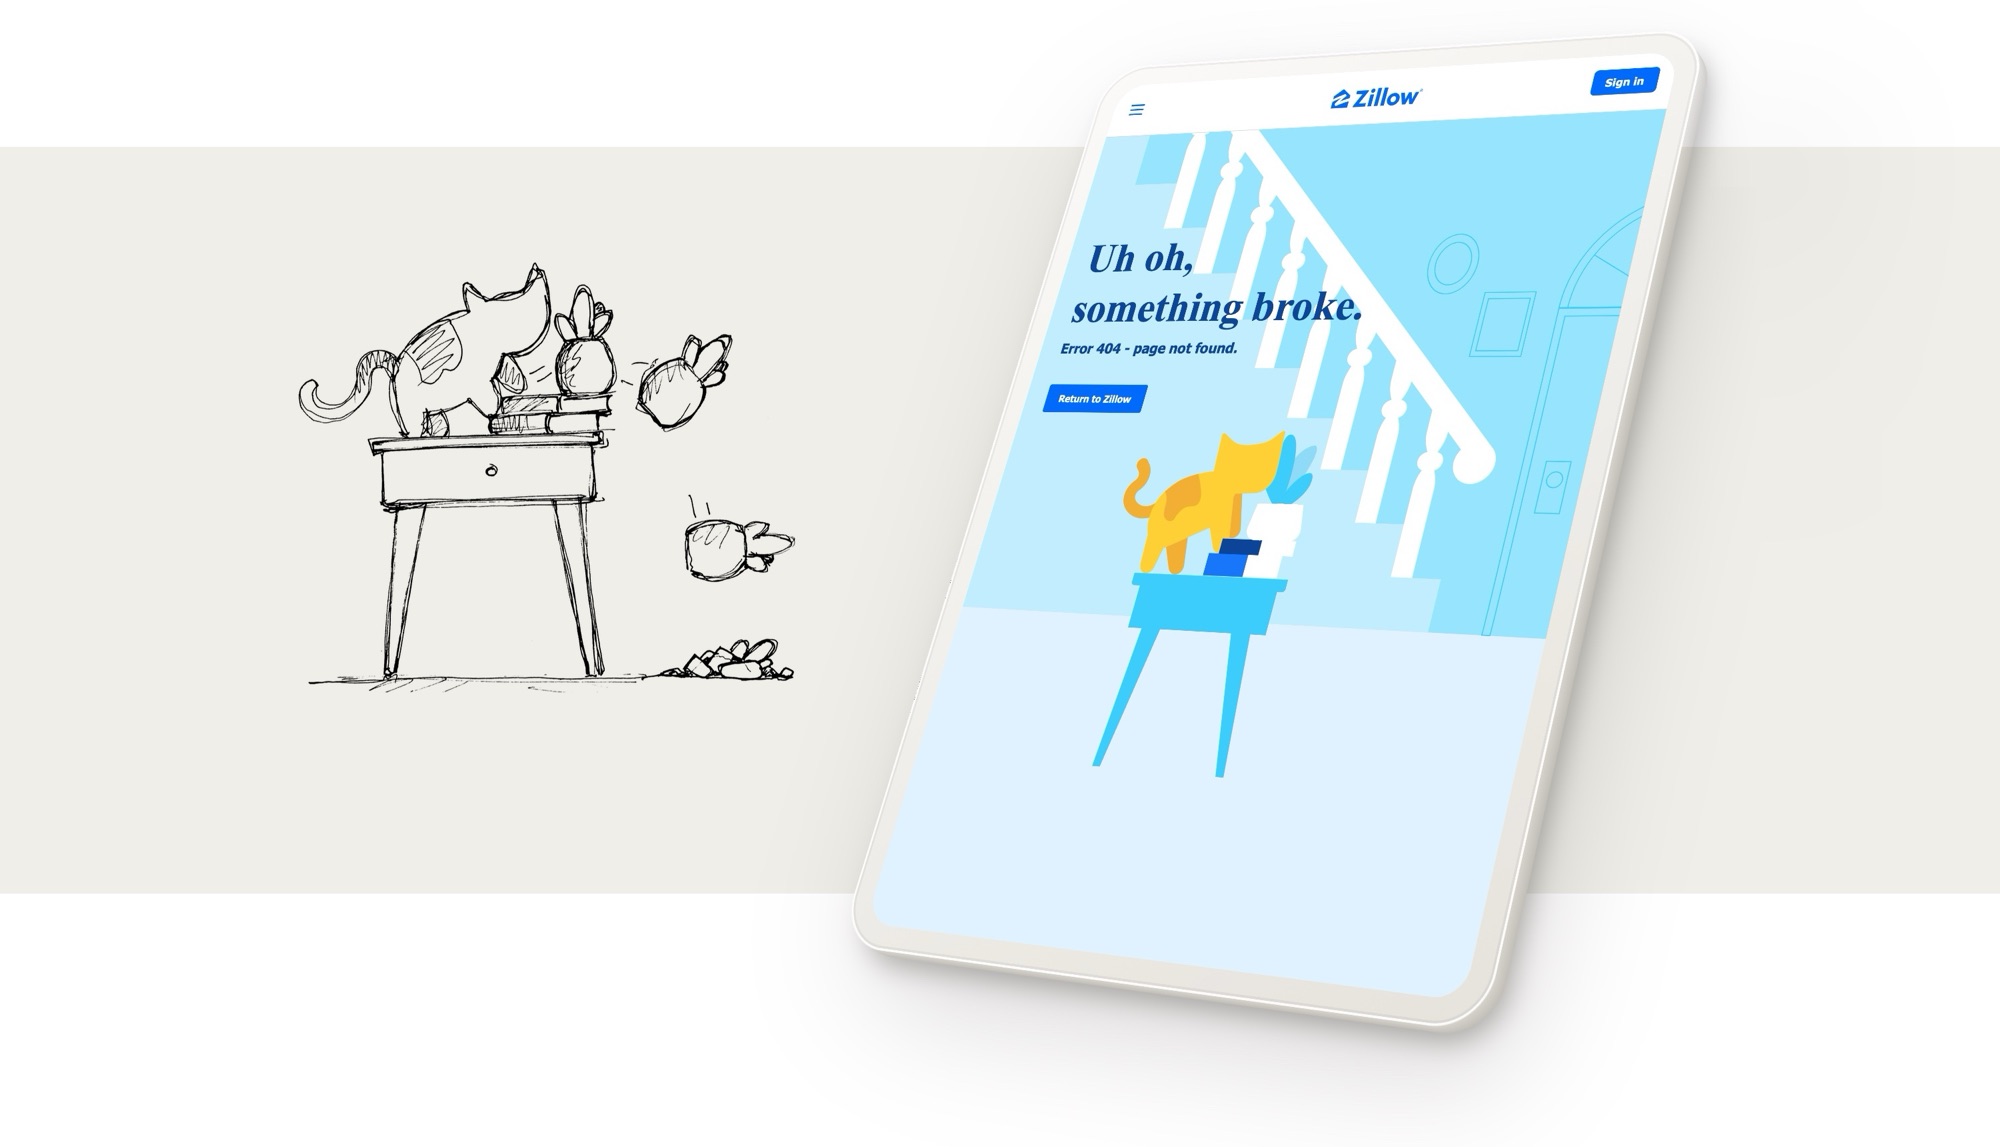
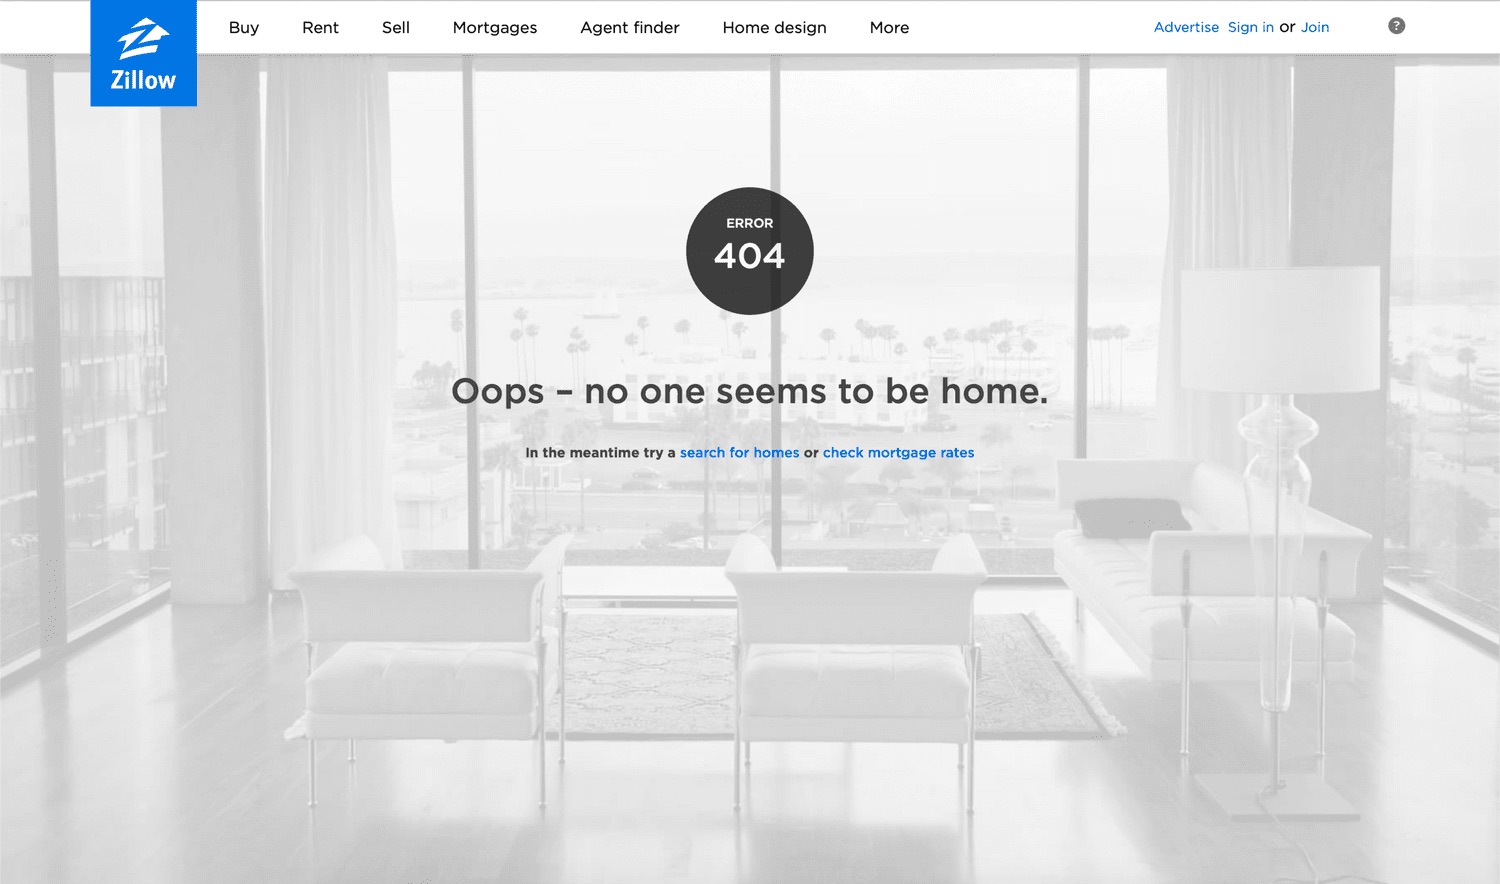
A Zillow 404 page designed and built in five days. The team’s entry, built on my concept, won Hack Week and launched, and it’s still live on zillow.com.
Overview
I was one of 3 designers. My concept was chosen, and I made the first animation prototype that sold it. The design team finished the assets in two days, which left the engineers three days to build.
Process
With five days in total, we sketched fast with the goals in mind, and brought in the right people to vote so we could keep moving.
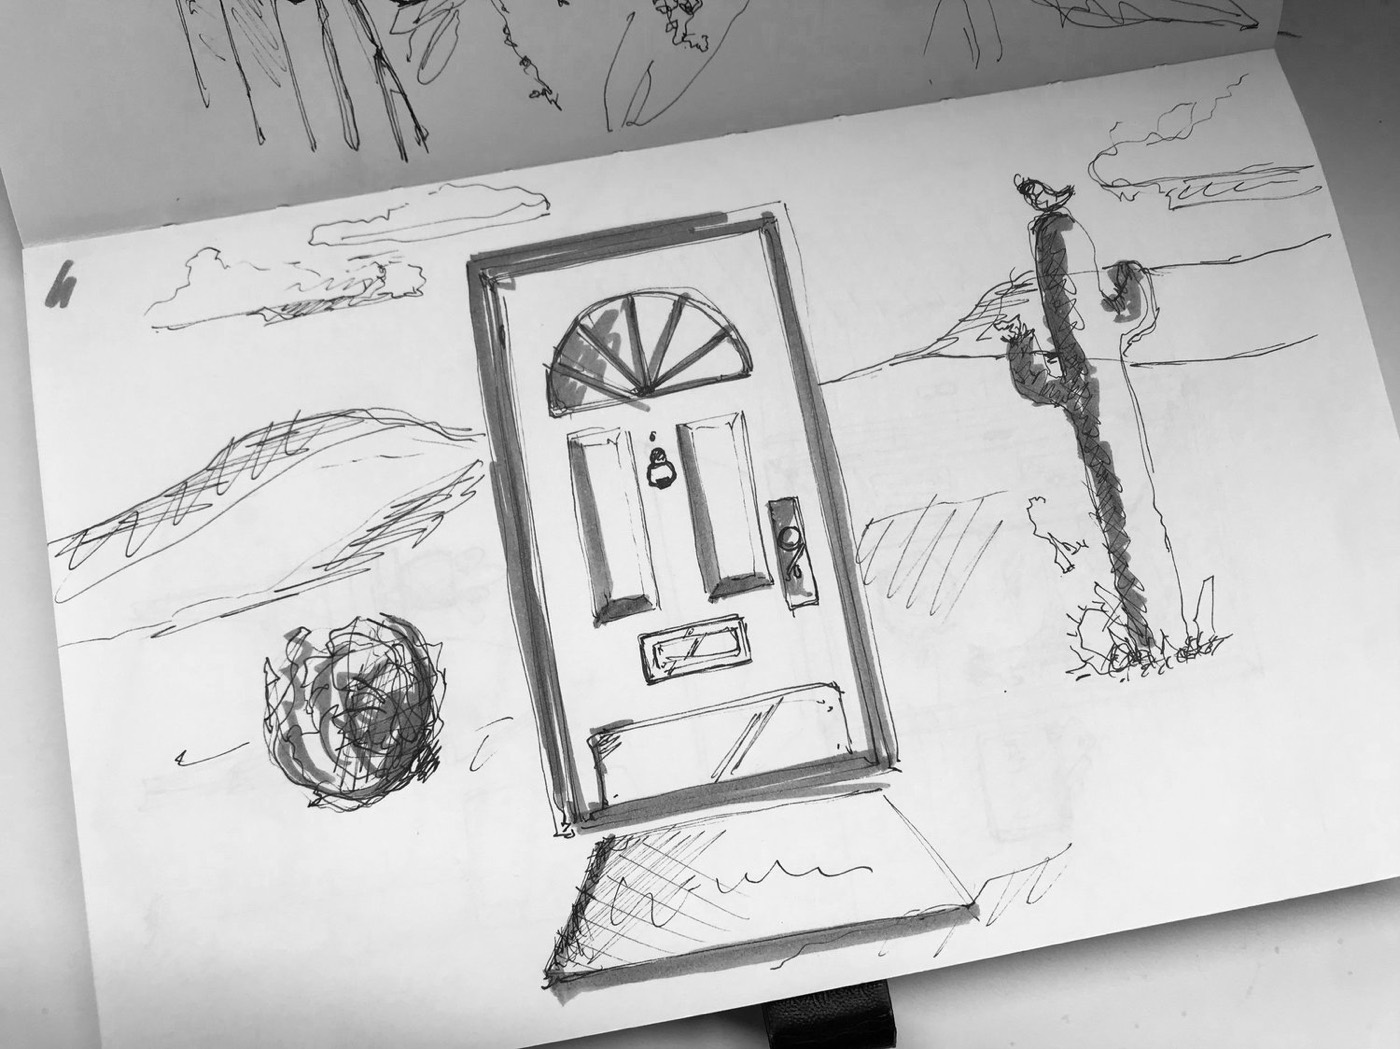
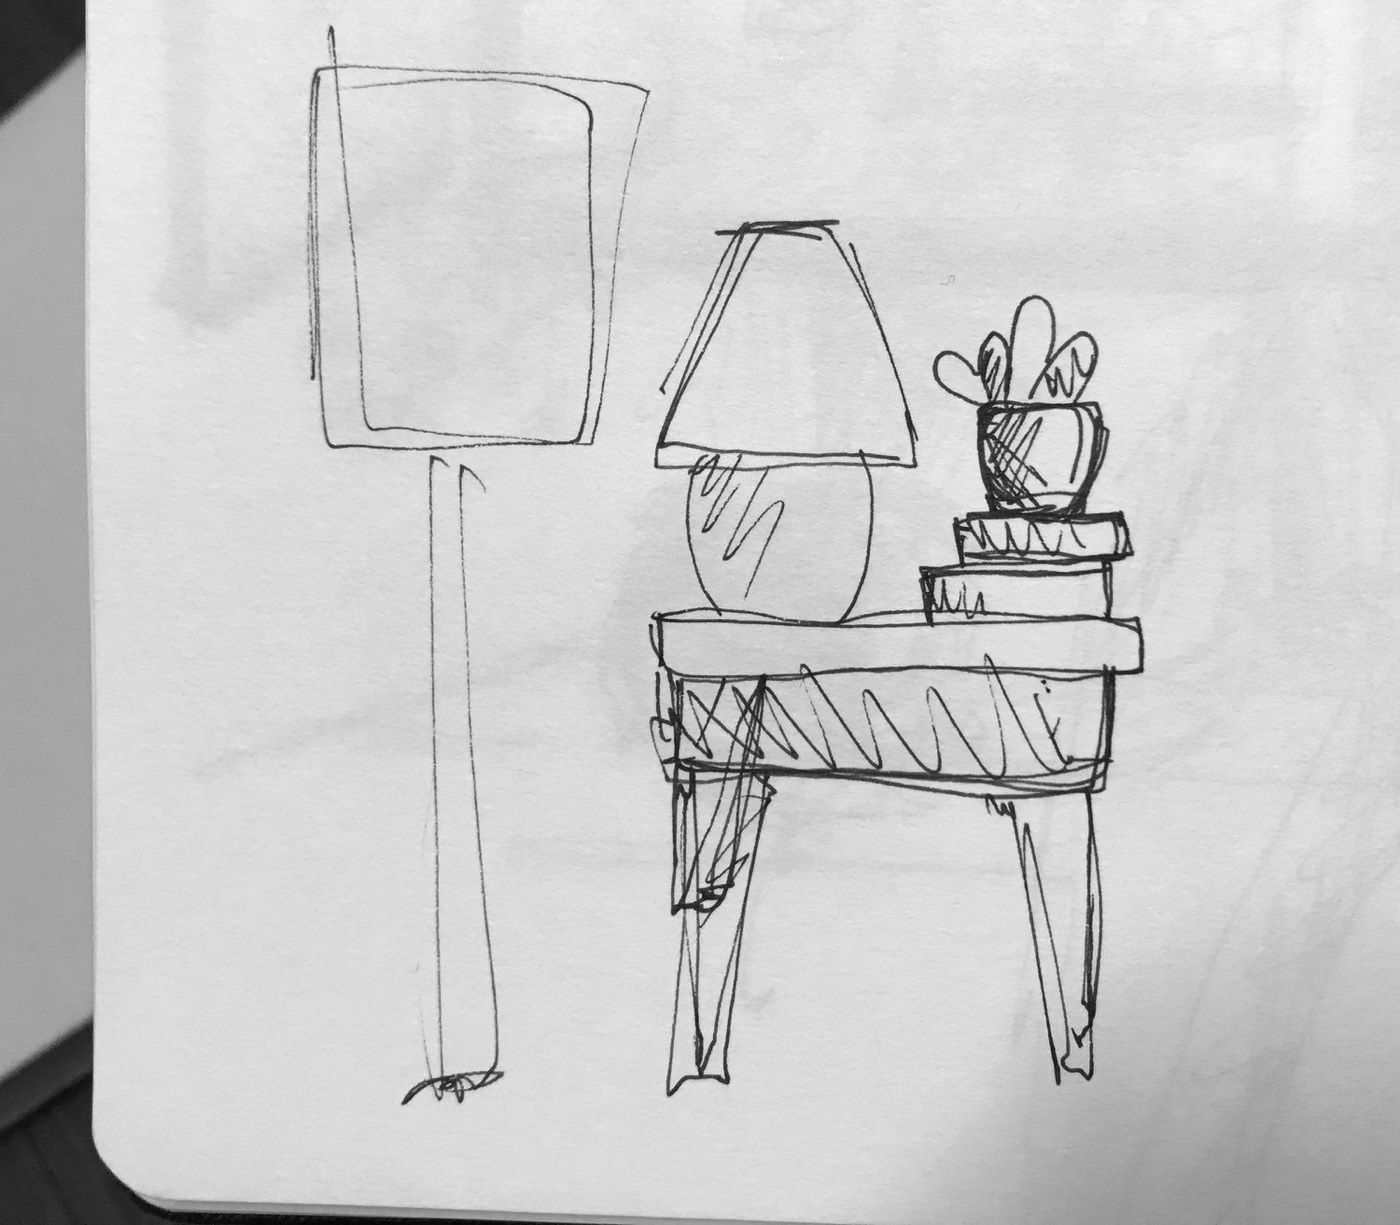
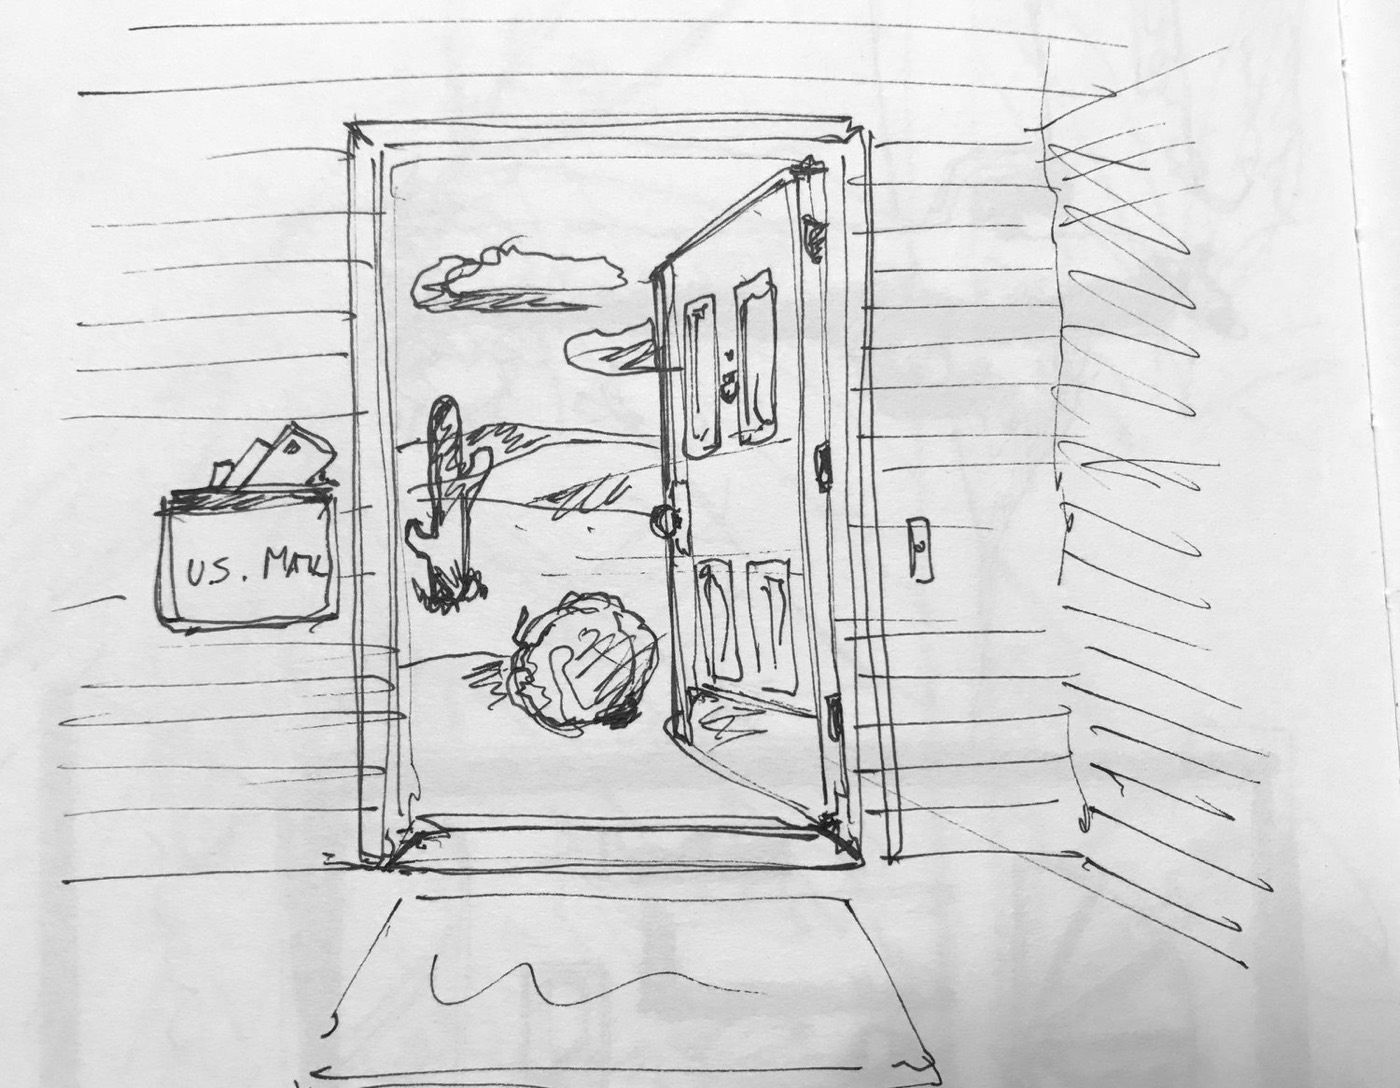
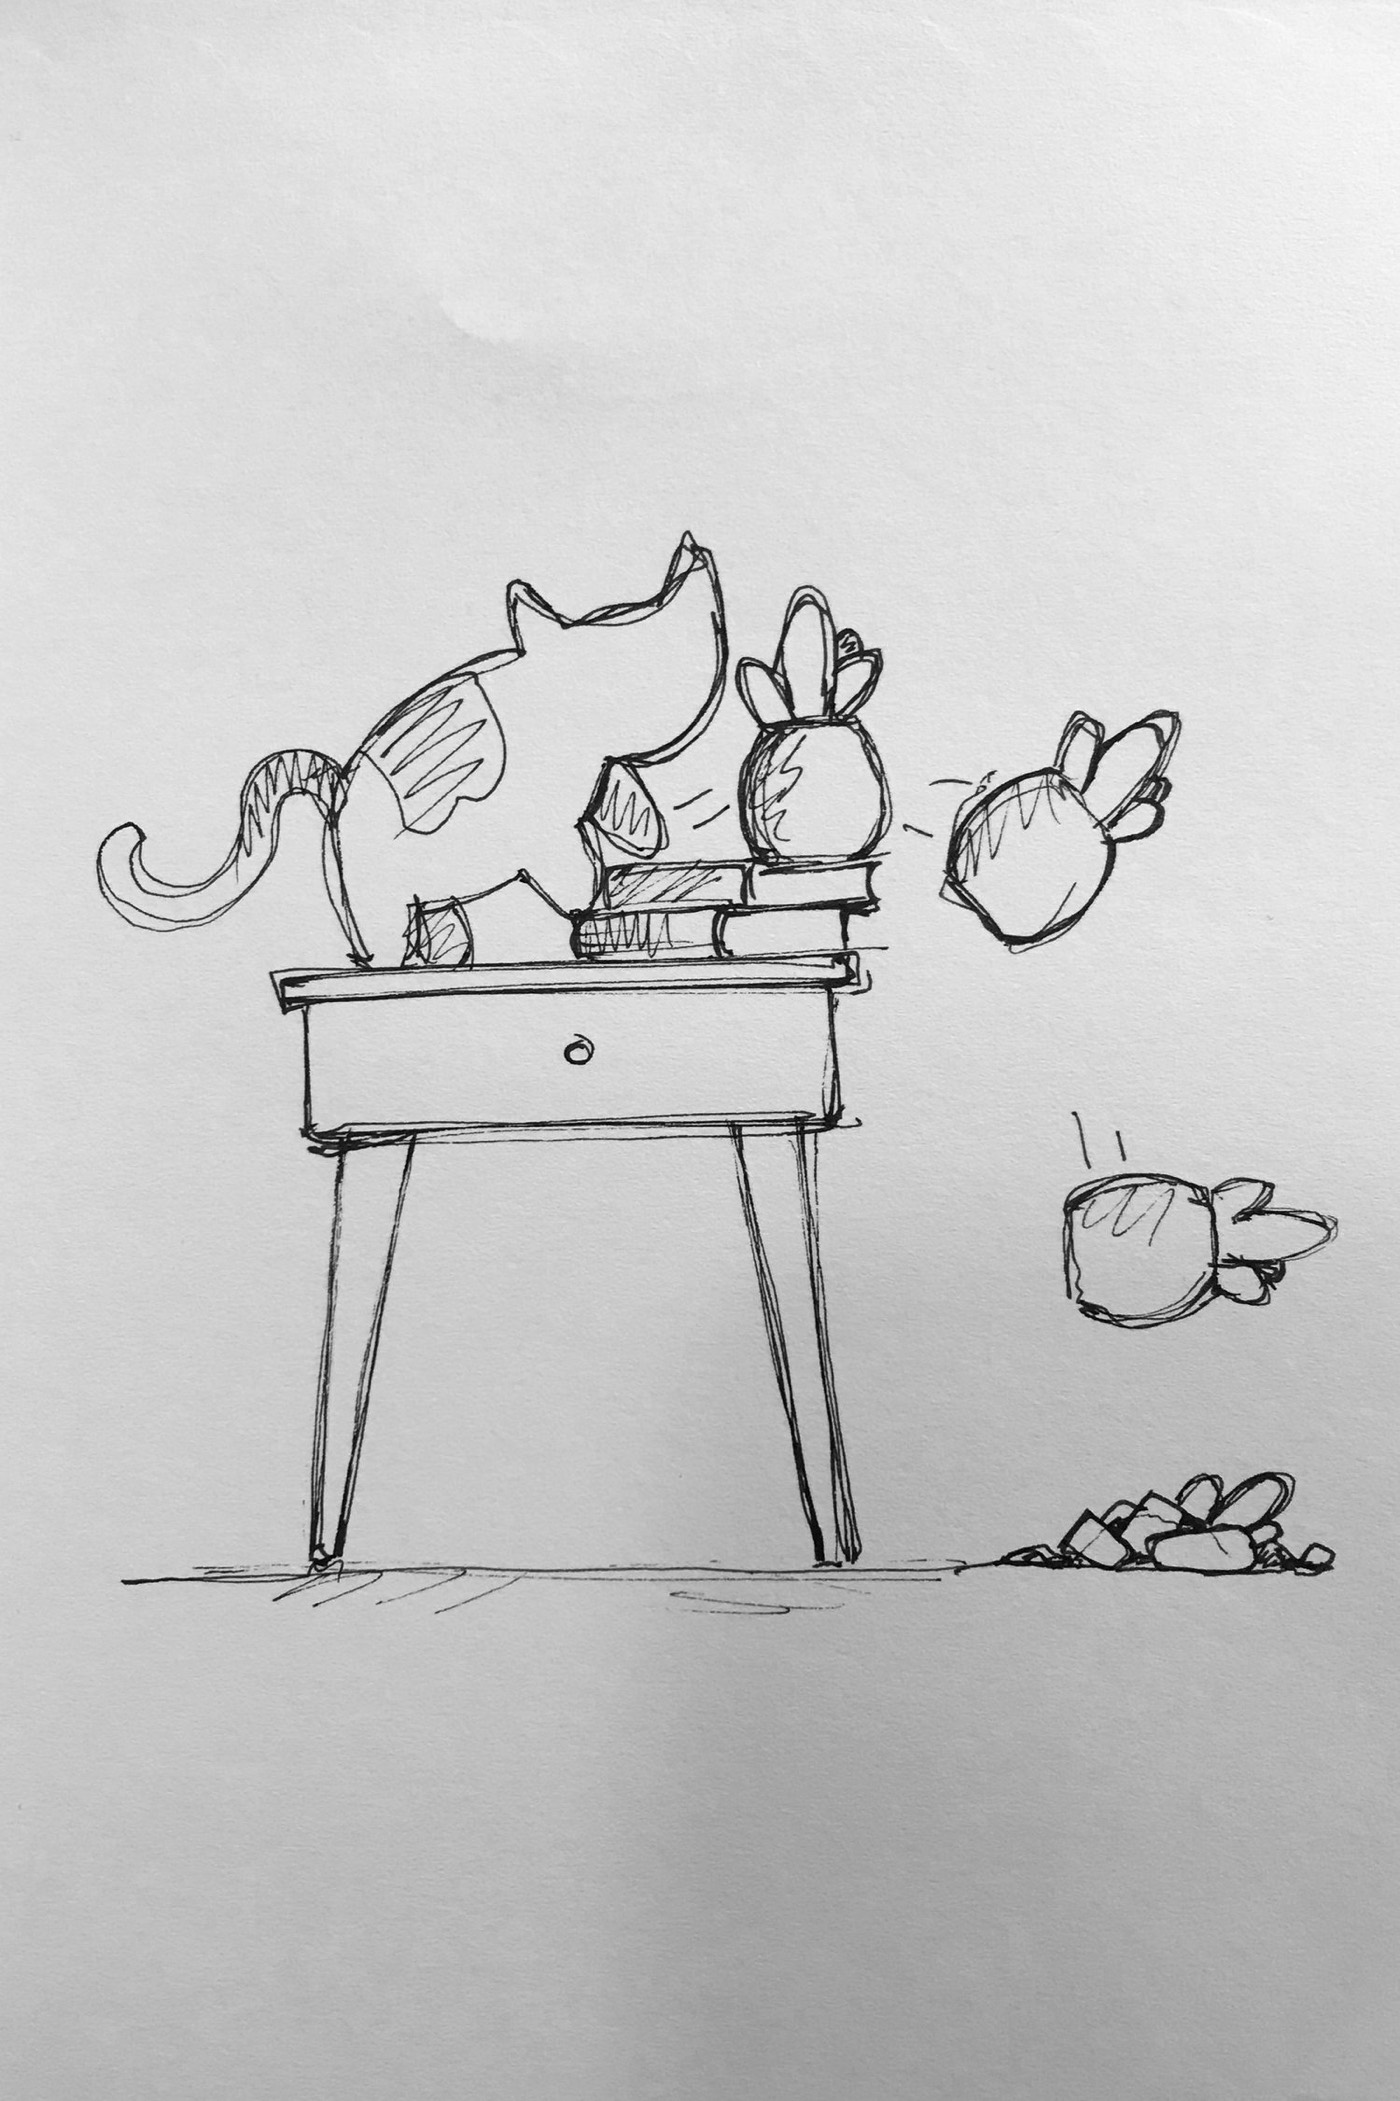
We presented the ideas, voted with stakeholders, and picked a few to refine.
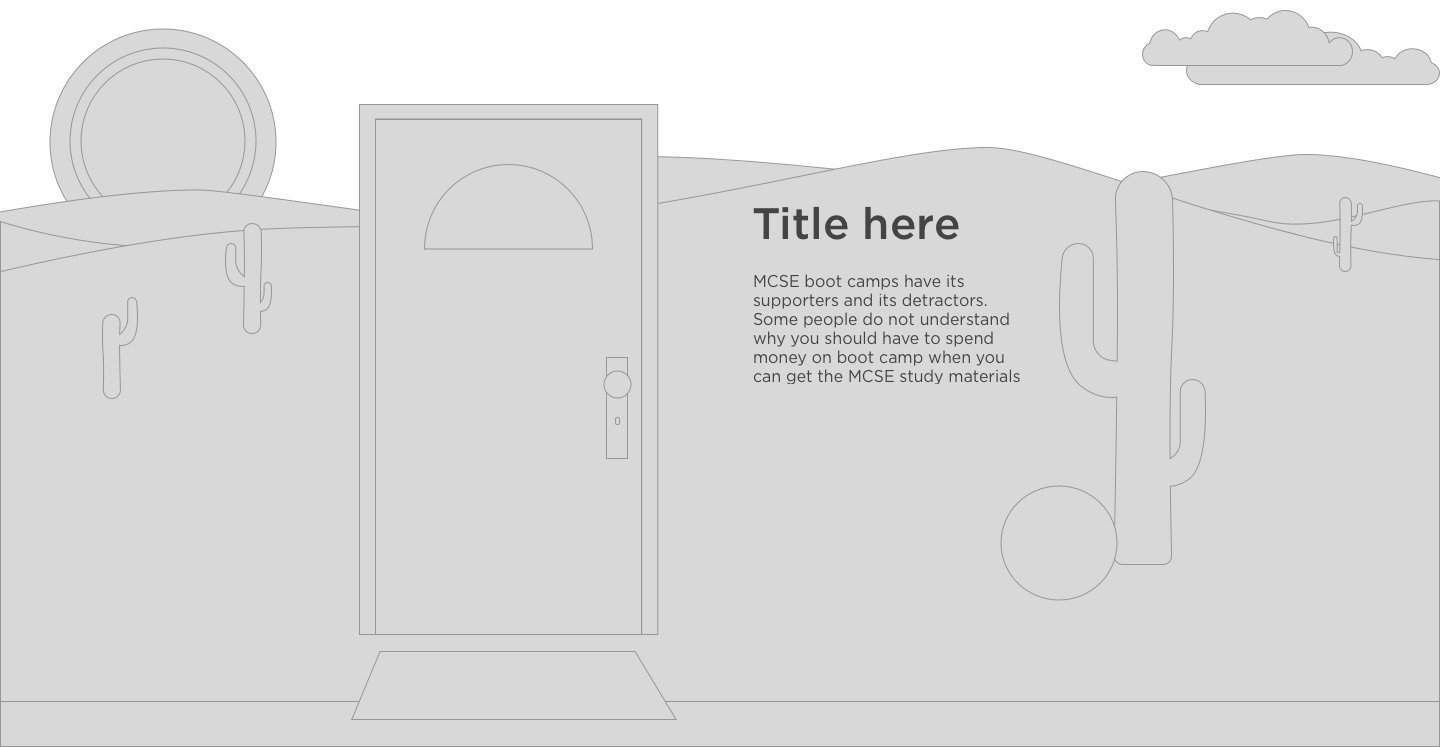

Static screens couldn’t show the feeling we were after, so I prototyped the leading ideas as animations in Principle.
Result
The team picked bad cat unanimously. It was easy to connect with, close to where the Zillow brand was heading, and simple to make responsive. Who doesn’t like cat antics? It was built in After Effects and exported with Lottie, so it stayed light on every screen size.
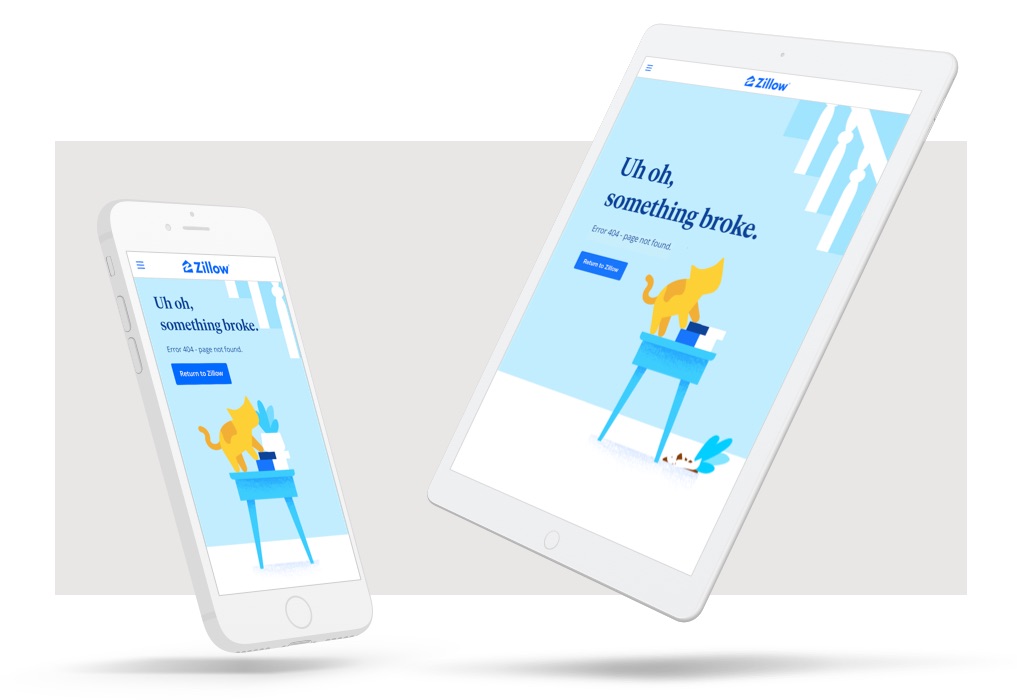
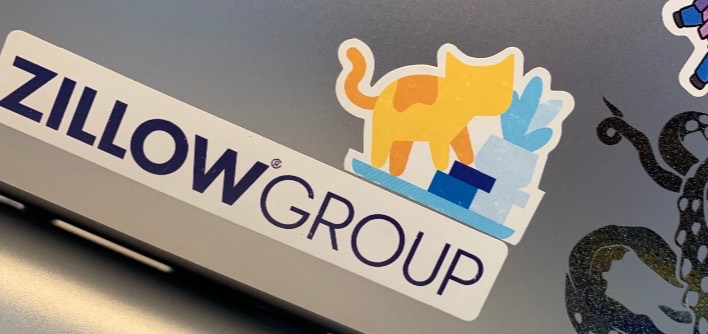
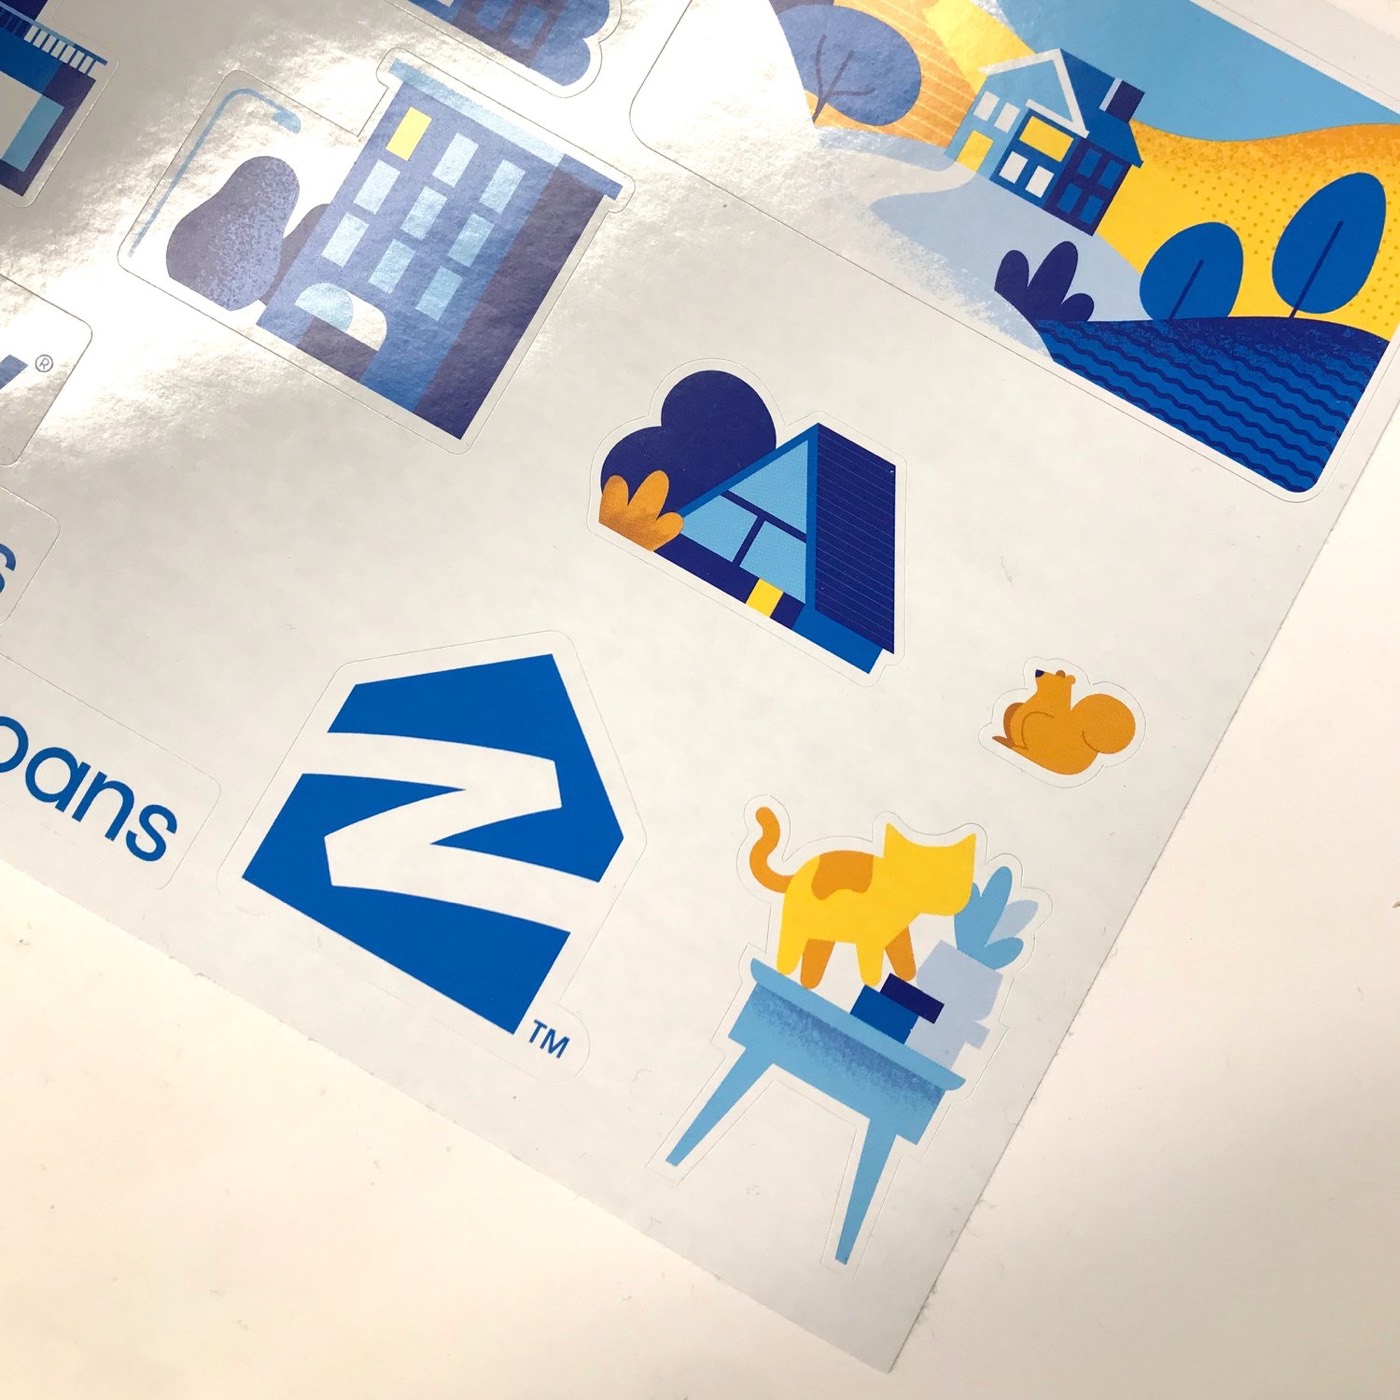
We won Hack Week, which earned the project the resources and approval to launch. It’s still live on zillow.com. “The Kitty 404” became a small icon inside the company, and a sticker on laptops everywhere, much to IT’s dismay.
Conclusion
I hope most people never see this page. Winning was nice, but the real win was showing other teams that polish and motion are possible in days, with off-the-shelf tools. With more time, I’d have explored a looping animation or a more satisfying final state.
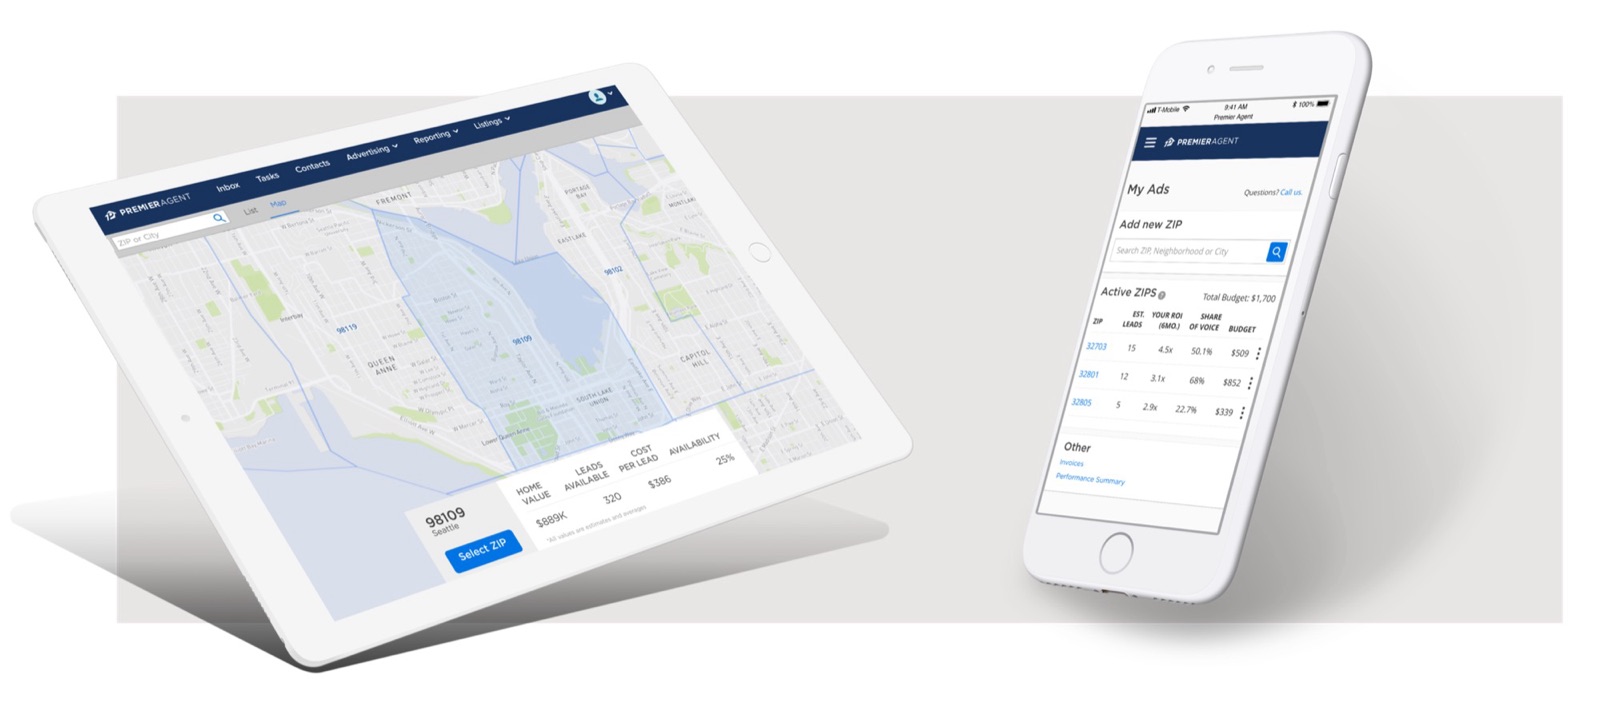
I was the sole designer of a platform, built from scratch, where real estate agents buy their own Zillow ads. Before it, every purchase meant calling the sales team. Half of all purchases moved to self-service in its first year.
Overview
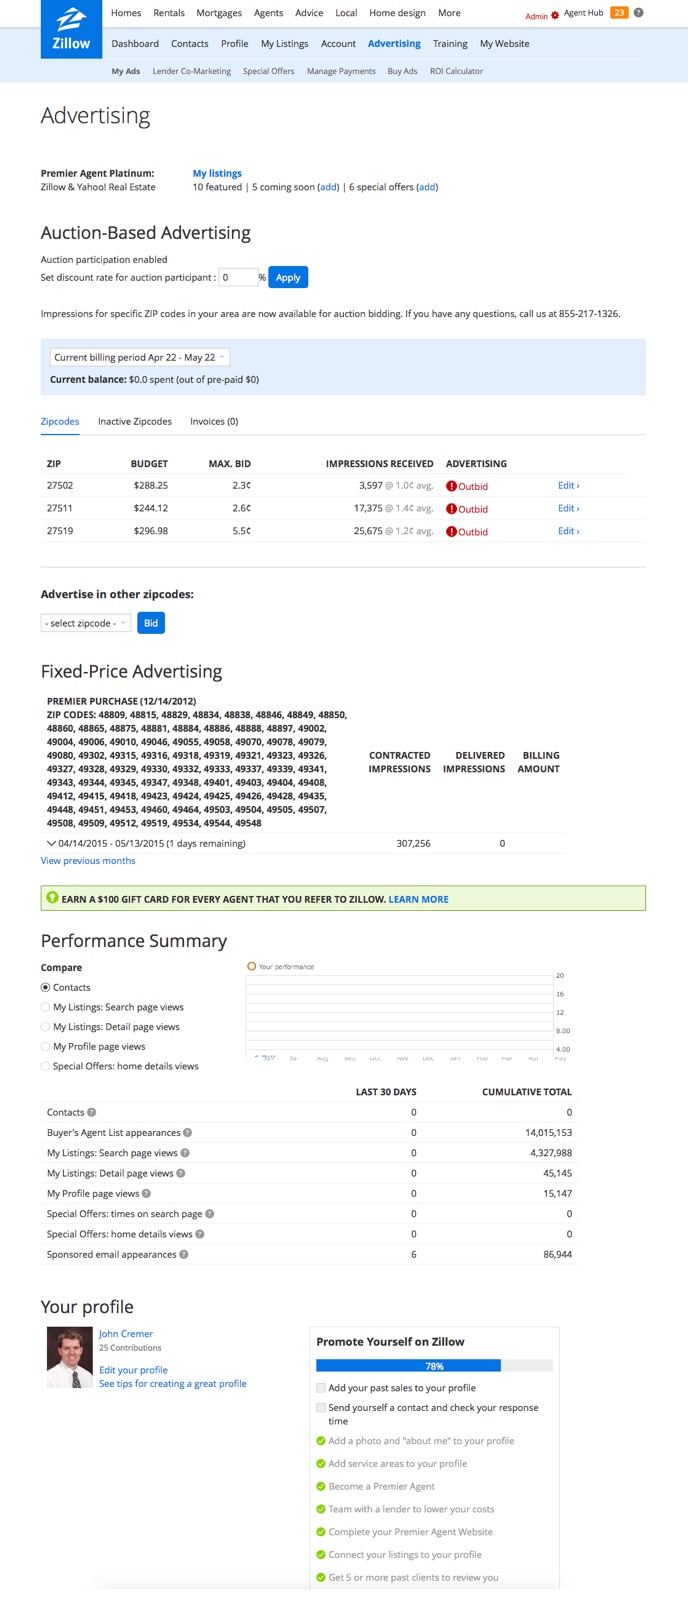
Zillow sold advertising to real estate agents by ZIP code, exclusively through a sales team and at fixed prices that didn’t stay fixed, on a product line that couldn’t scale to meet agent demand. UX research and the business found the same problems with the old platform:
Goal
A new platform, built from scratch to replace calling sales, with auction-based pricing, where price follows demand, and where agents can find, buy and adjust their advertising anytime, from any device.
My role and team
The only designer, from the first flows to launch and post-launch research, with a PM, an engineering team and UX research. Major decisions went to a committee from leadership, analytics, finance, legal and product.
Process
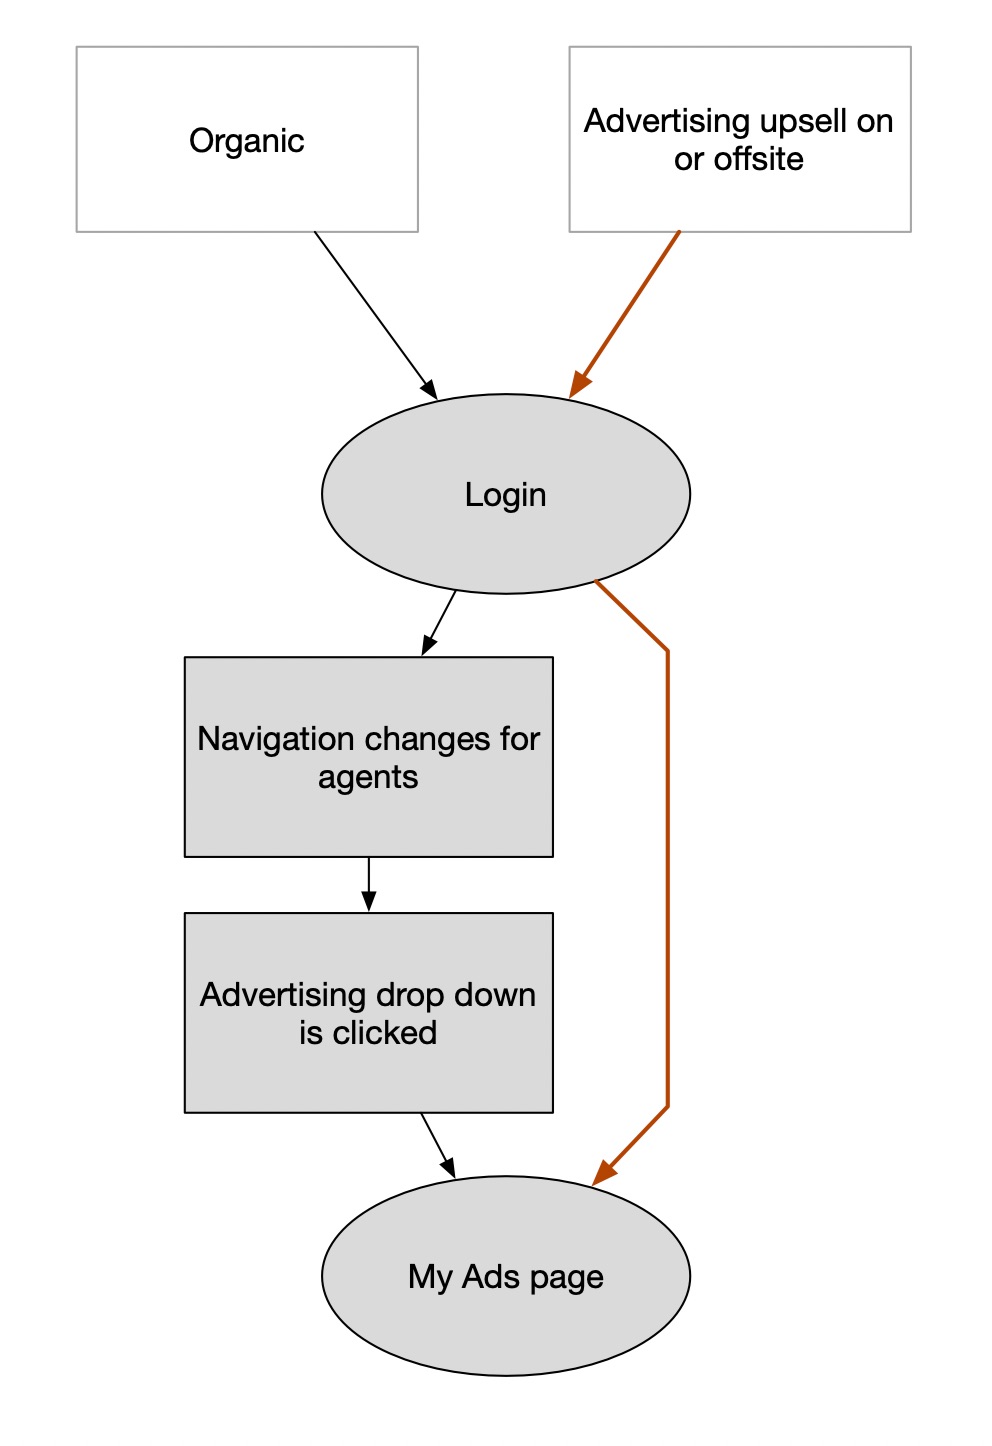
I talked to the sales team to learn how agents think about buying advertising, then talked to agents myself. I reset the goals around the agent as the main user, on any device, and got stakeholder sign-off. Then I mapped how agents would arrive and the whole purchase path, so each next step was obvious.
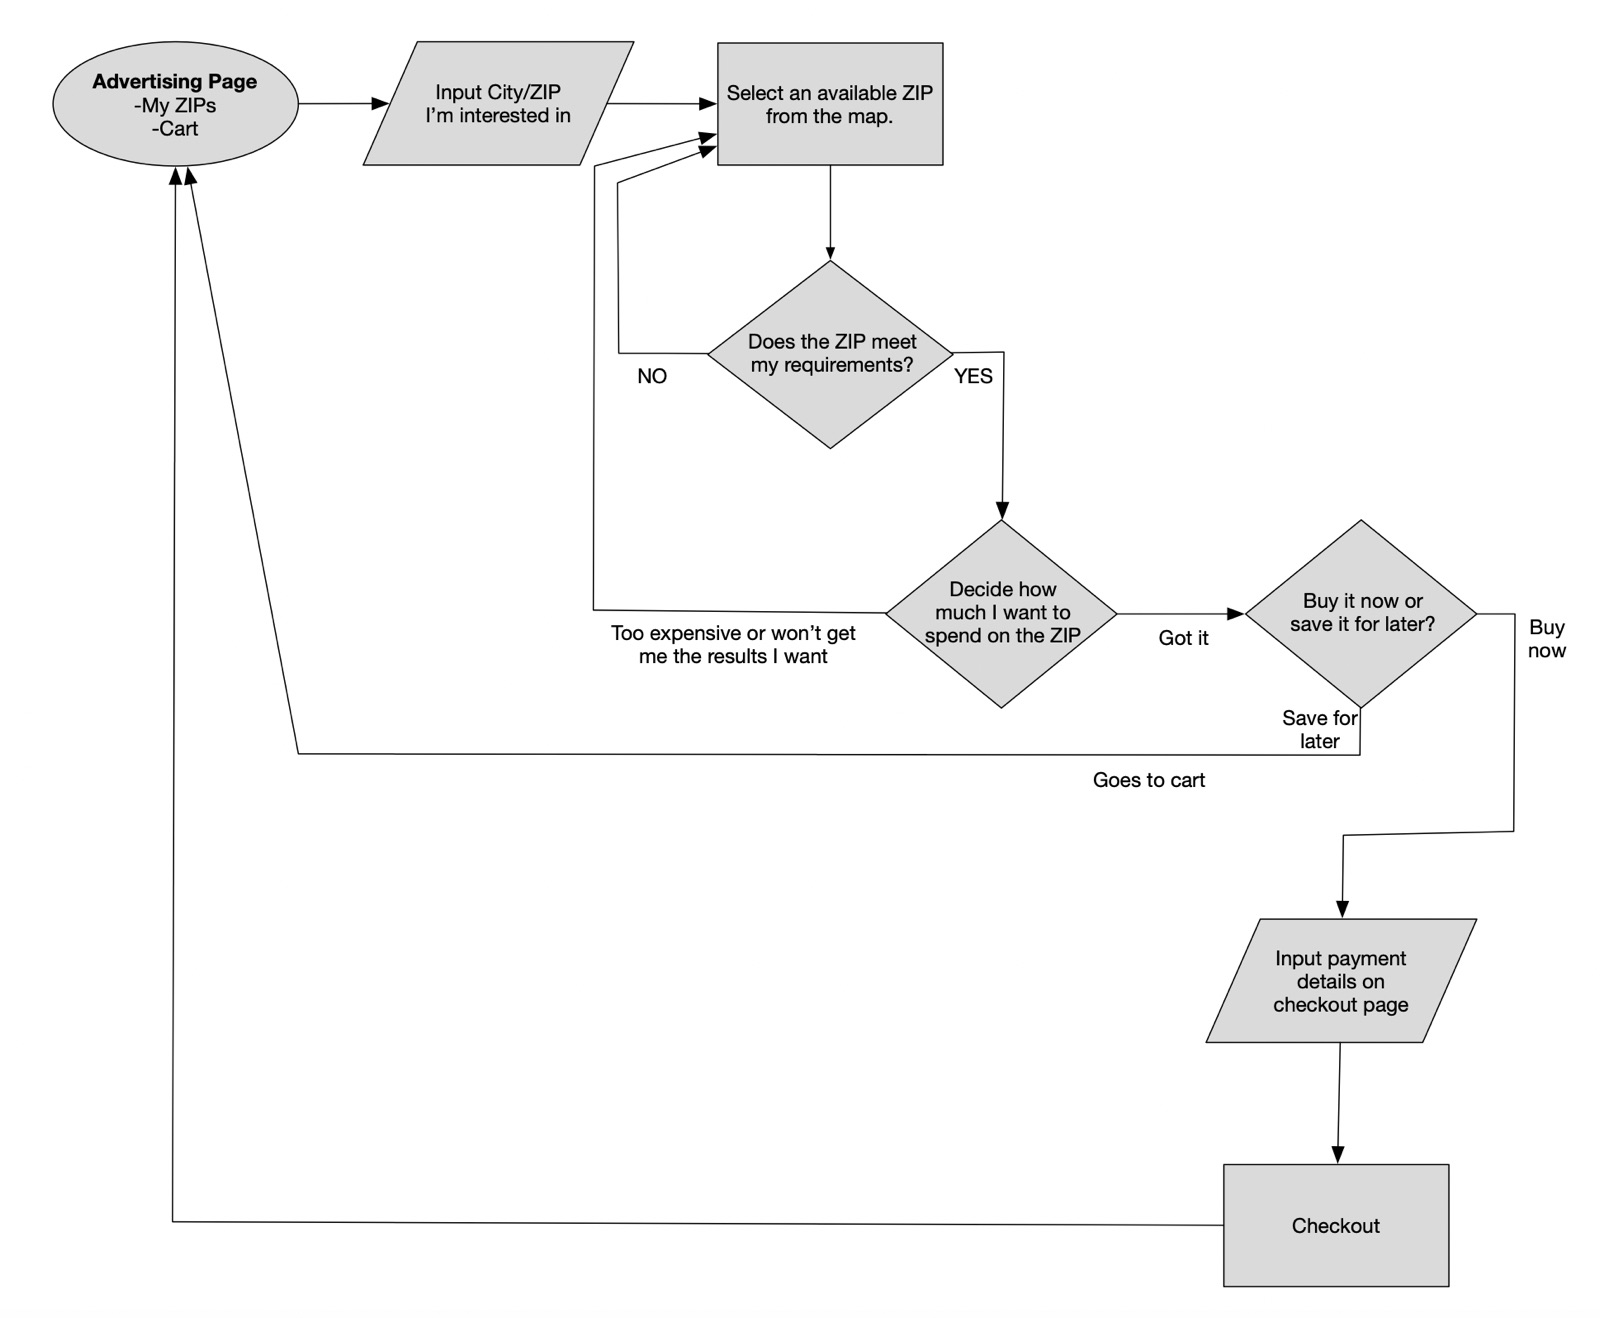
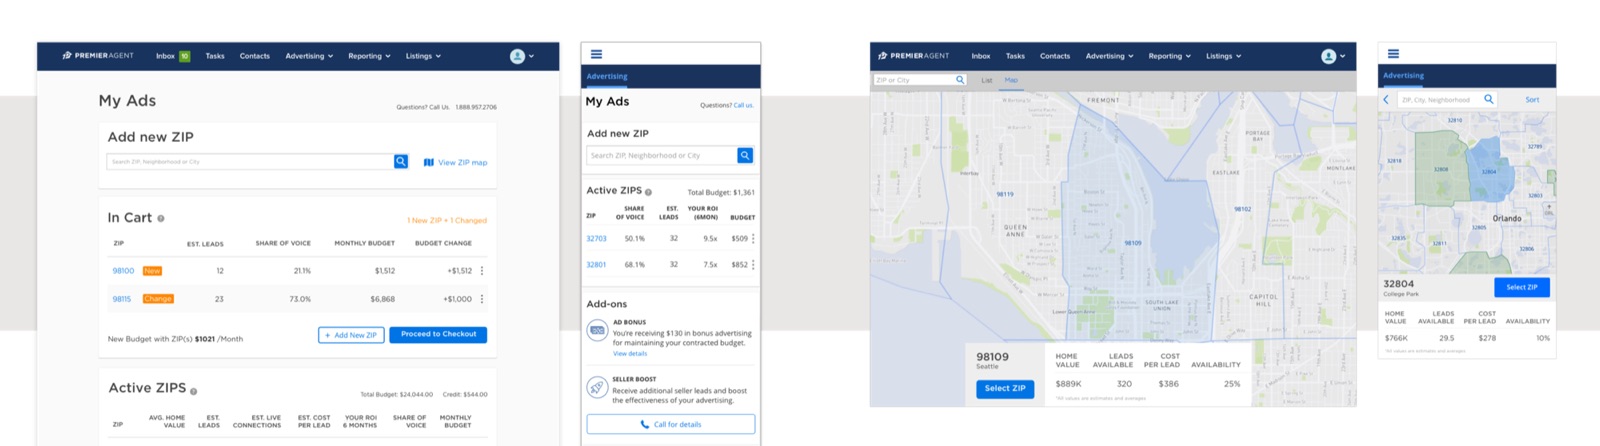
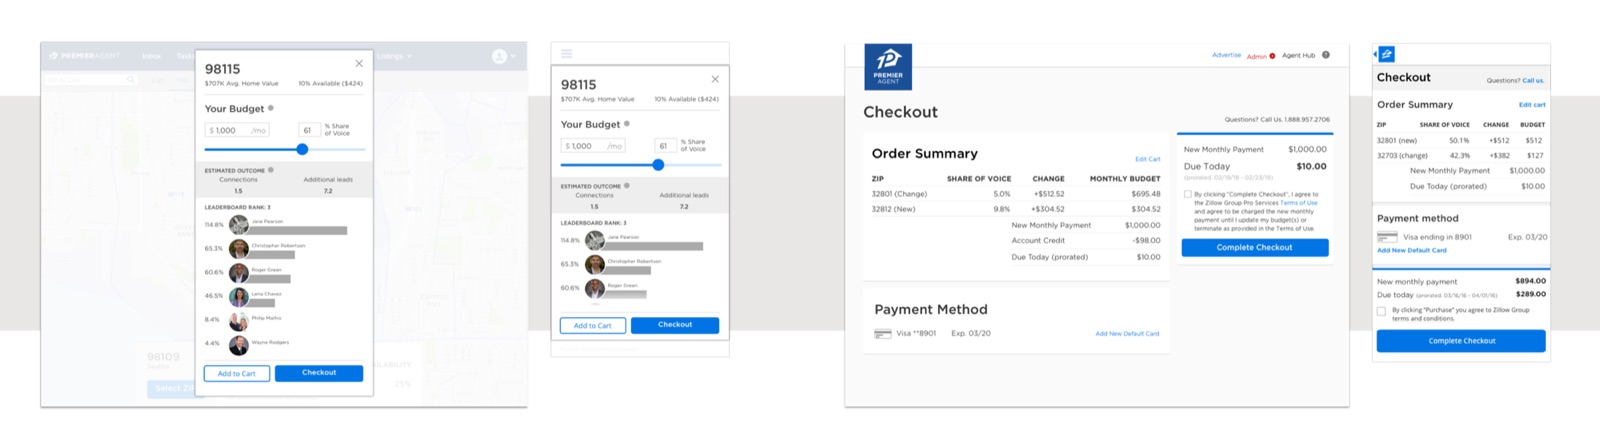
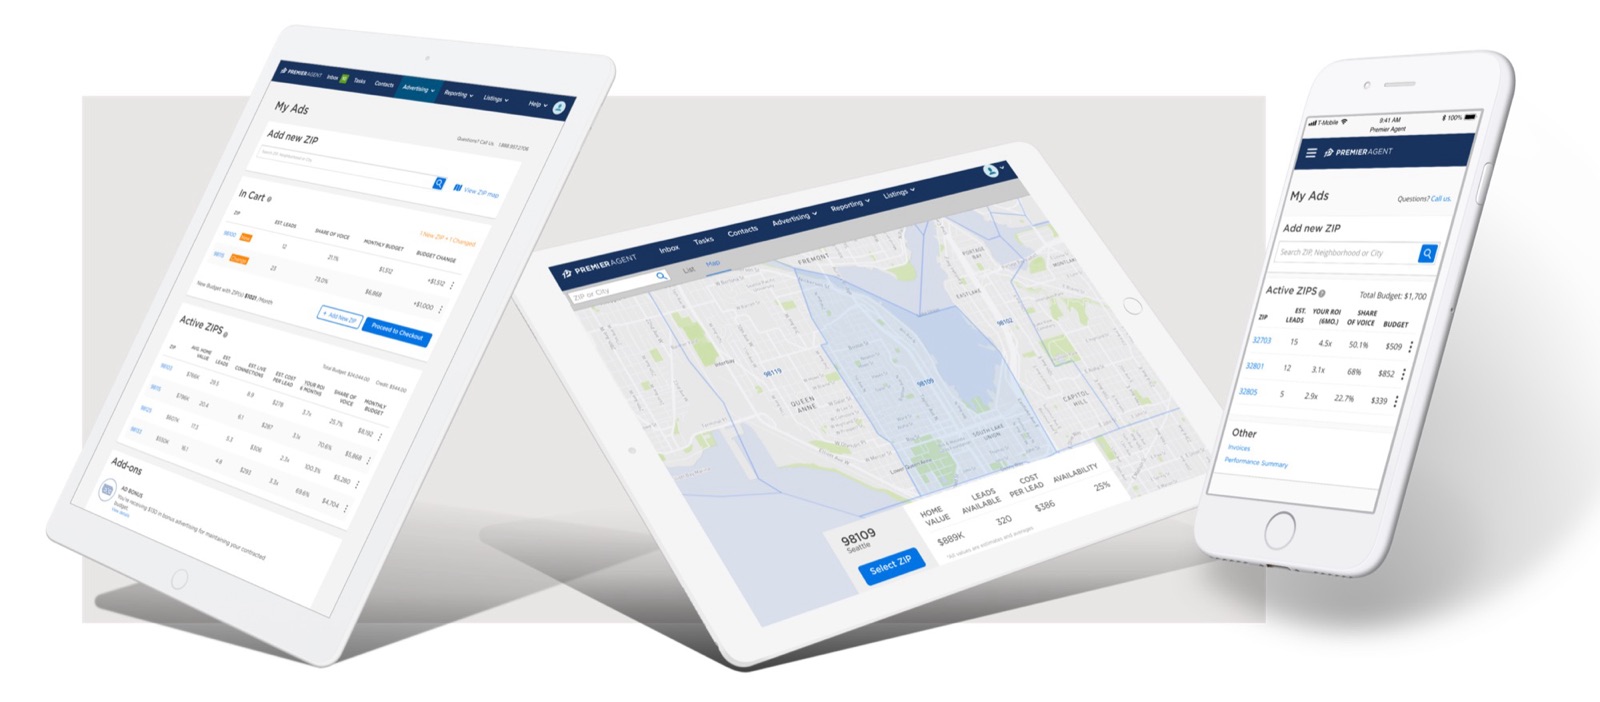
Mobile first, quick mocks a step above wireframes. Agents used to work out their share of a ZIP by typing dollar amounts until the percentage looked right; I replaced that with a slider that shows spend and share together as you drag. The team and I pushed for a map-based experience, even though it didn’t work well on a mobile browser at first. We did it because that’s how agents think about their job: in areas and neighborhoods.
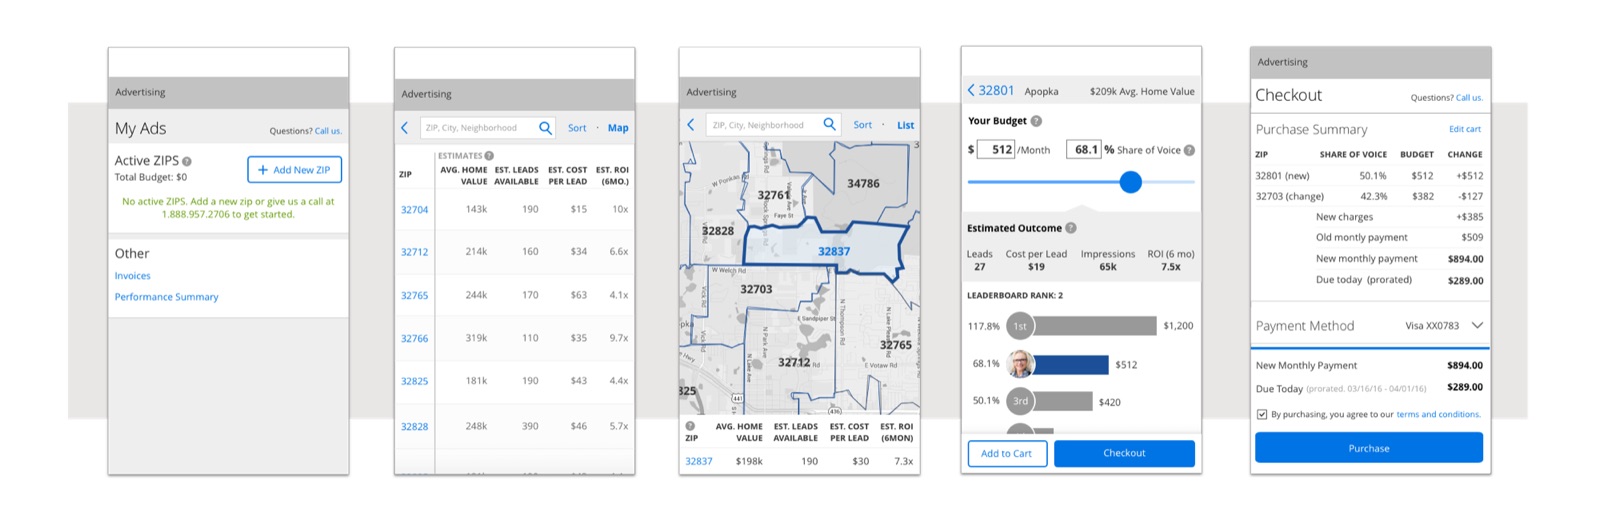
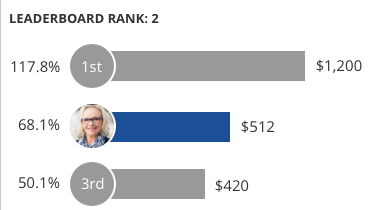
No major usability issues. Agents moved from profile to adding a ZIP to checkout without help, could say what each next step would do, and understood the difference between the cart and checkout. They liked the slider. Two problems came up: the data overwhelmed some agents, and the leaderboard pushed spending on ego rather than return. Keeping the leaderboard became a business decision: agents competed to be first in the ZIPs they bought into, which raised spend. Agents knew it pushed them to spend more, and still wanted it there.
I ran a card sort to cut the data down to what helps a decision, brought the design in line with the style guide, and made ZIP discovery and the map, where agents decide, more prominent. Then we launched and learned.
Research and results
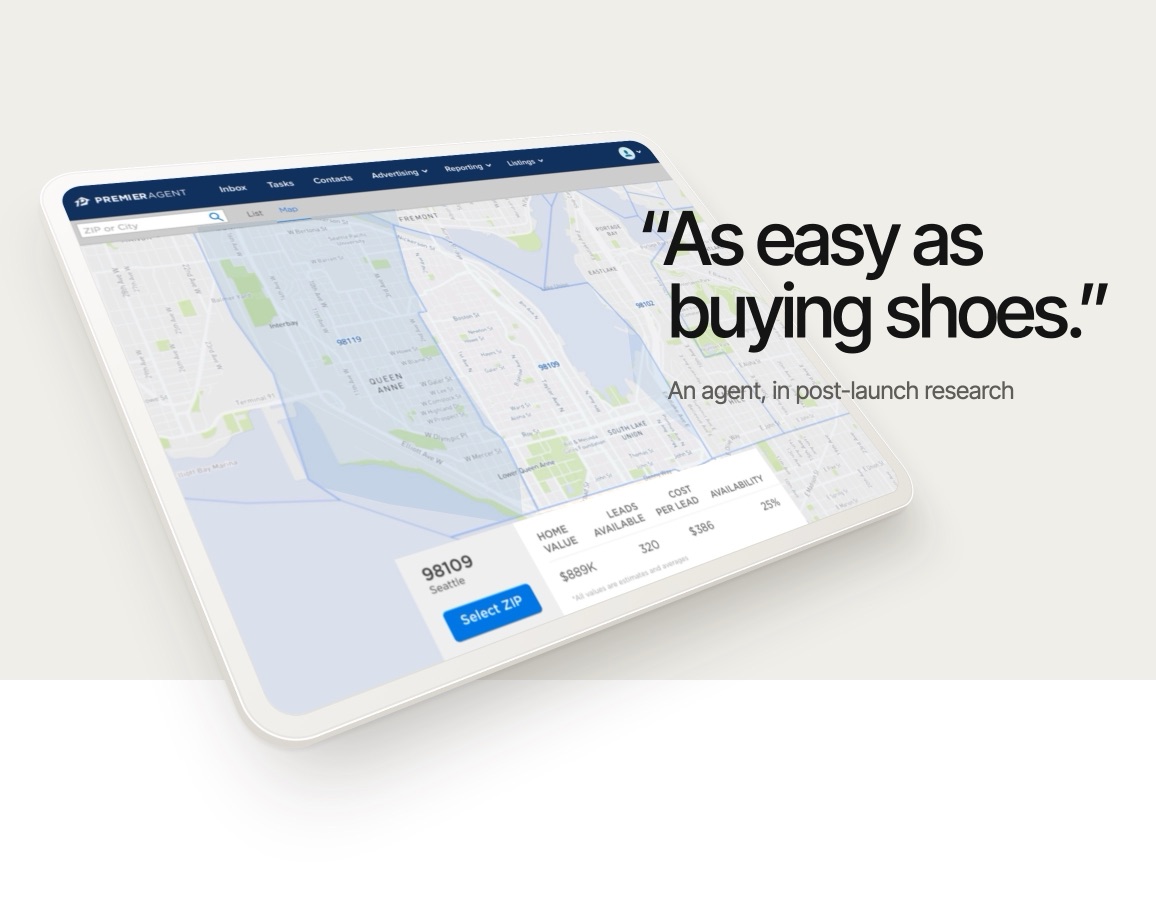
Two more rounds over six months after launch confirmed agents could buy, adjust and check out without trouble, even those new to the product. One agent said it was “as easy as buying shoes.” Research also left things to fix: the slider had no undo, agents ignored the tooltips, and showing how return on investment was calculated would build trust.
Before launch, almost every purchase was made by sales on an agent’s behalf. After launch, agents increasingly took on managing their own spend, even from day one. Although the sales team was reduced, it still held a valuable spot, helping some agents onboard and looking after select legacy customers and VIPs.
of purchases were self-service a year after launch, so sales spent far less time making changes for agents.
Conclusion
In 2019, the platform’s product line generated over $1B.
We worked iteratively, learning from agent feedback and usage data as we went and tuning the tools along the way. For example, the self-serve controls let agents raise their spend on weekends and lower it during the week, when buyers were less active. We hadn’t planned for that, and it broke lead delivery and allocation, so we adjusted commitments and freeze periods.
If I picked it up again, I’d do this, ranked by cost and impact:
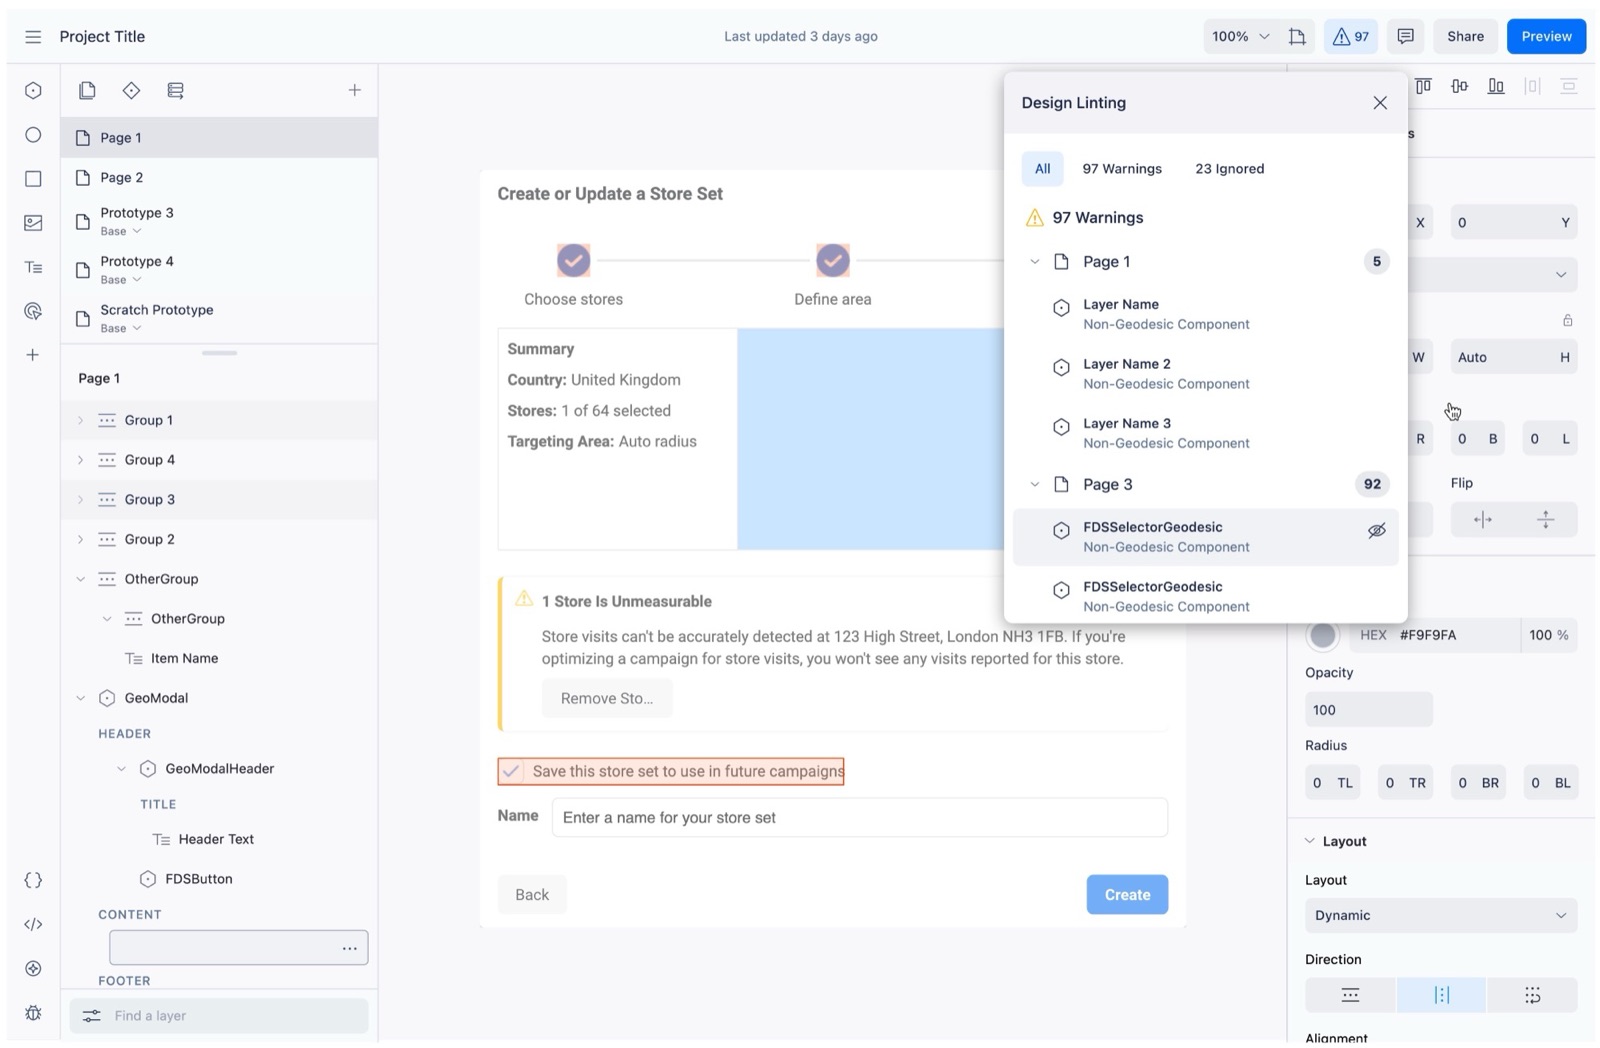
Design reviews relied on people spotting problems. I designed a linter that caught them earlier. It shipped to Meta’s ads org and carried on in Figma.
Outcome
I designed the tool, including how it could scale from 1 issue to thousands, and worked out how it could fit with the governance tools Meta uses to ship work. I was the only designer, working with 1 dedicated engineer and partners on Geodesic, and we did our own research.
Problem
Proton was Meta’s React-based internal design tool, built to scale design systems across the company. In 2020, the governance tools around it were mostly manual and sometimes subjective, limited by the person reviewing the work.
It’s easy to miss things. A design could be approved and built while drifting from the system, adding design and tech debt.
Hypothesis: if we flagged departures from design systems automatically, during design and review, designers would use more existing components, so fewer issues would reach build and teams would ship faster.
Focus
We started with Geodesic because it was the largest and most built-out system. If linting worked for them, it would probably work for others.
“Are Geodesic’s visual elements and styles applied as well as possible?” is a good review question, but it’s hard to answer objectively. It breaks down into checks a tool can measure, such as whether spacing follows Geodesic’s standard values and whether form elements are full width. Linting helped check and measure them.
Solution
Designers could find and correct issues themselves before anyone reviewed the work, so they could ship faster. The beta highlighted issues on the canvas and grouped them by severity, page and type.
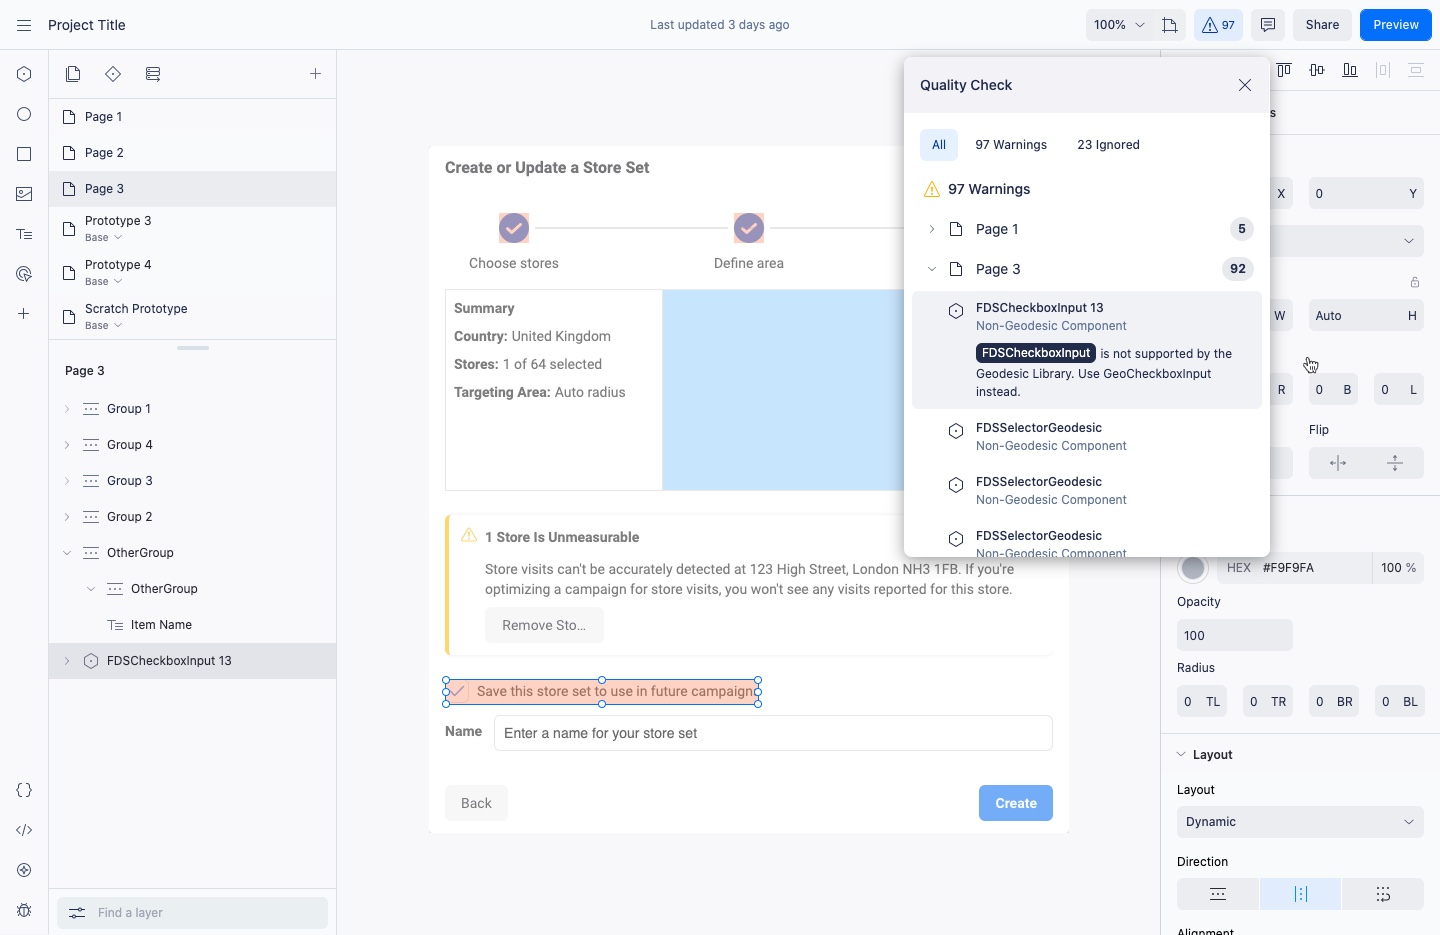
Instead of relying on what a reviewer happened to notice, linting would give reviewers factual things to ask for, running automatically when a project was shared to be built. This was being set up and on the roadmap when Proton was retired.
In Proton
In review
Revisions go back to the designer, in Proton
Then
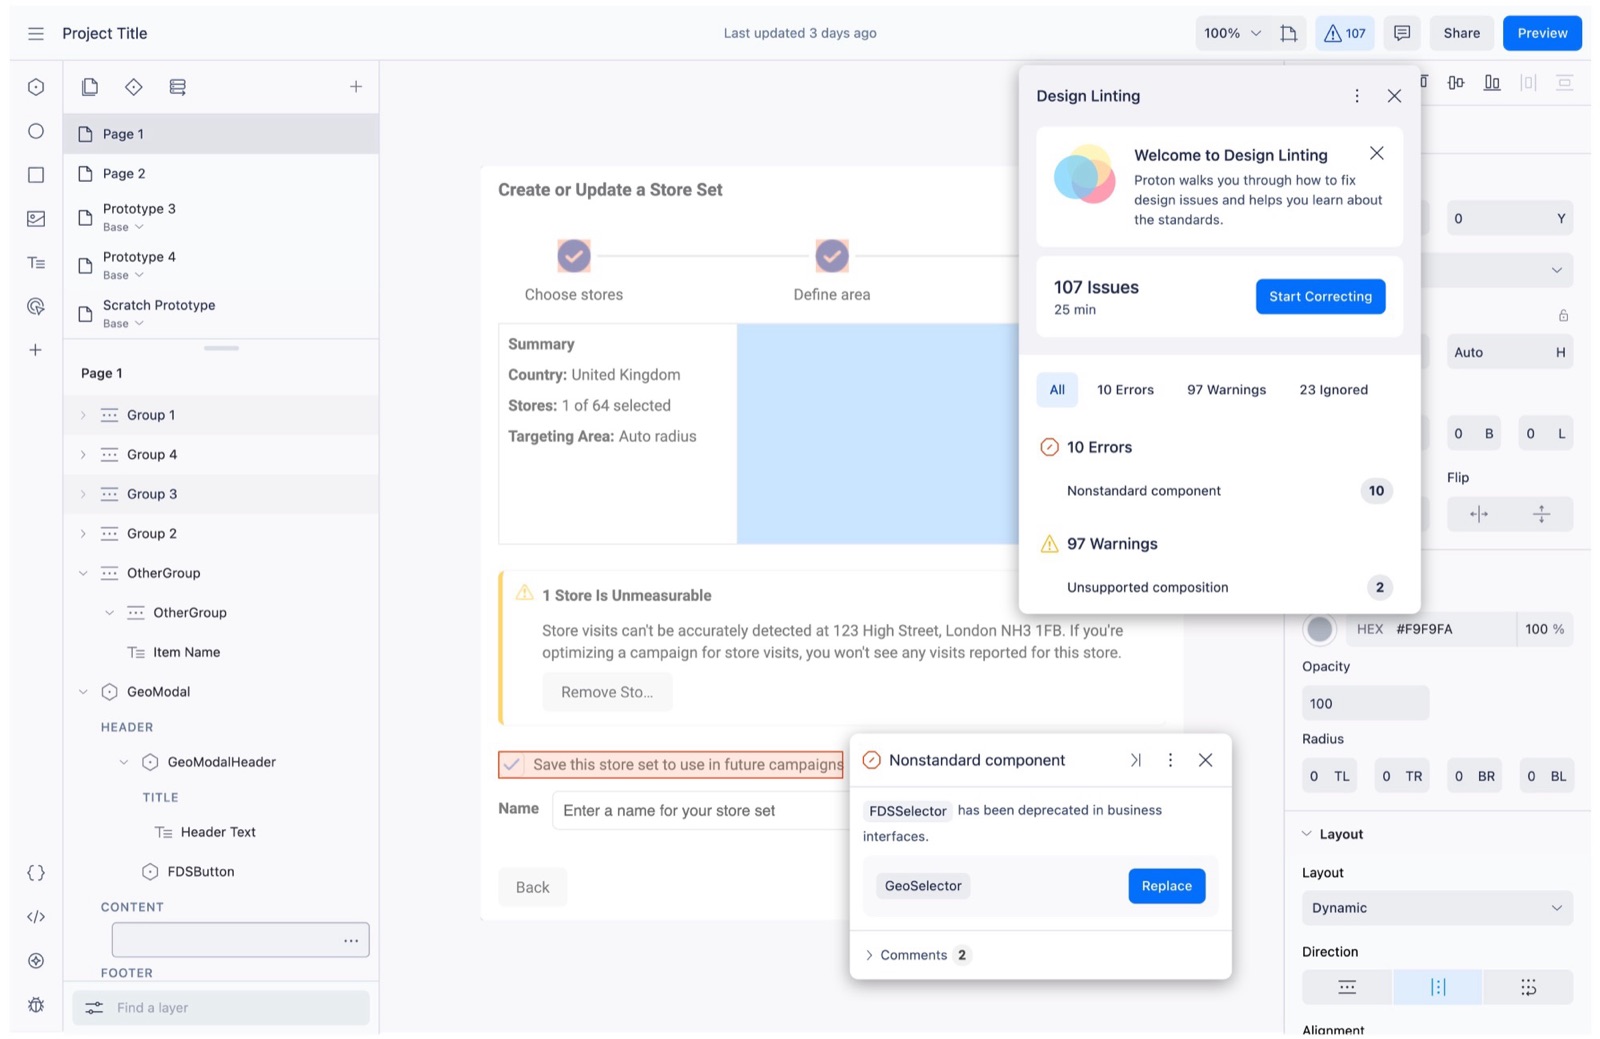
A project might have one issue or thousands, so the design had to work for both. The next phase, designed but not built before Proton was retired, would have added errors and warnings, a time estimate, and a way to step through fixes.
Conclusion
Proton was retired before linting could expand further, for reasons outside the team’s control. Another team continued the work and brought it into Figma, so the checks moved on with the designers. The review connection we had roadmapped influenced that follow-up.
Hard calls
Meta’s ads tools announced new features by interrupting people, and the messages piled up. I pushed for better developer tools, governance and documentation, and designed components, motion and rules so messages showed up at the right time and place.
Outcome
Our key metrics improved in early testing*: revenue, click rate and impressions went up, and dismissals went down.
*The exact metrics are still confidential, as the work is in public testing.
Frustrated by how often the ads tools leaned on modals and other disruptive components, I raised it and asked to fix it. That led me to feature discovery and onboarding, where most of these messages came from, an ambiguous and messy problem. I identified issues in tooling, governance and patterns, then came up with new pattern concepts in a design sprint. I owned the work-stream through partnerships, leading the design of the components, motion and visual signal, and working with product, engineering and leadership on the rules for using them. I partnered with and directed work from motion designers, art directors and other product designers across five teams.
Problem
Across Meta’s business tools, new features announced themselves the same way: by interrupting. In the ads tools, the approved options were big cards, modals and a blue tooltip built before Geodesic, Meta’s largest design system. They clashed with everything around them, appeared the moment a page loaded, and were gone for good once dismissed. With nothing limiting how many could appear, messages piled up on top of the work people came to do. Each team was measured on its own feature’s adoption, so the loudest pattern always won, even when it cost the page as a whole.
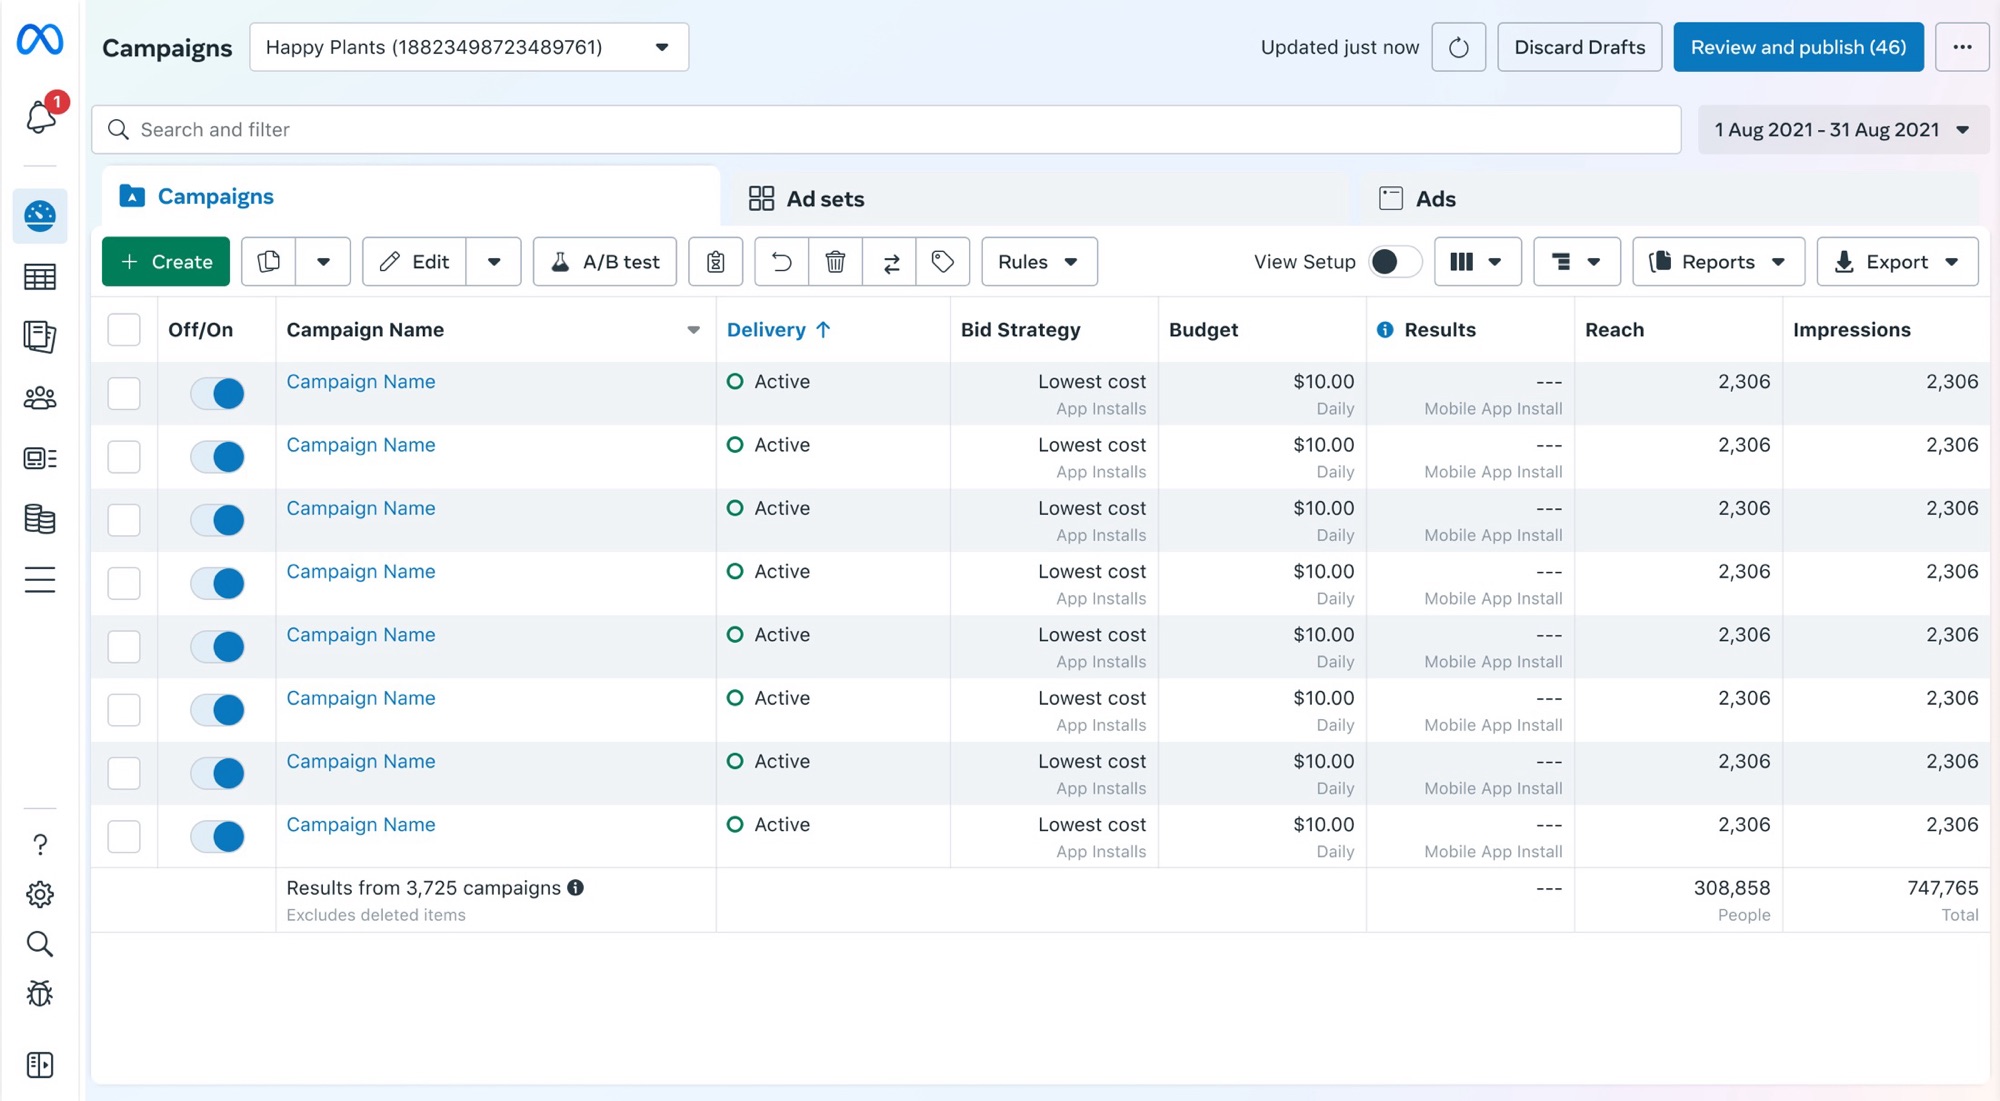
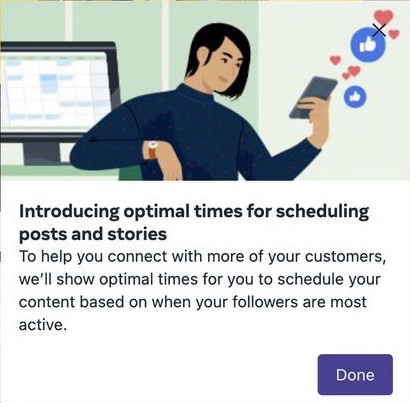
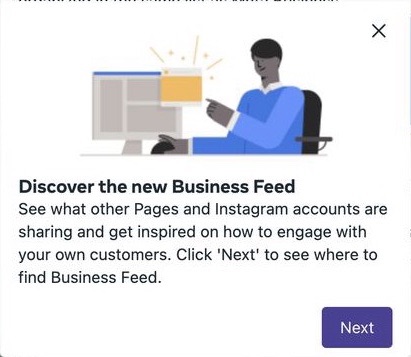
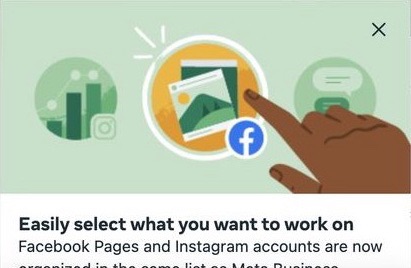
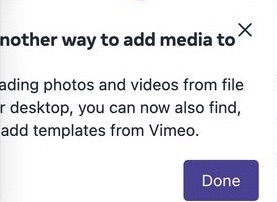
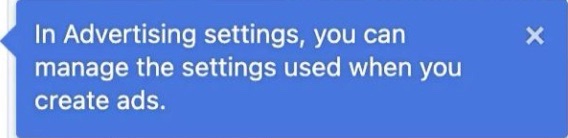
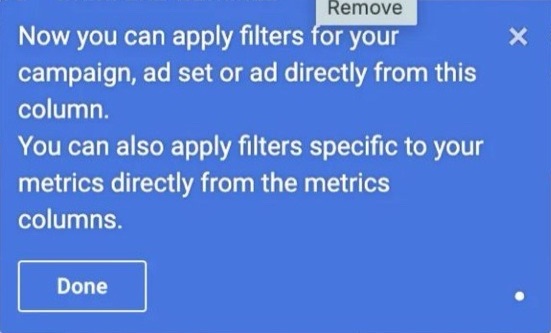
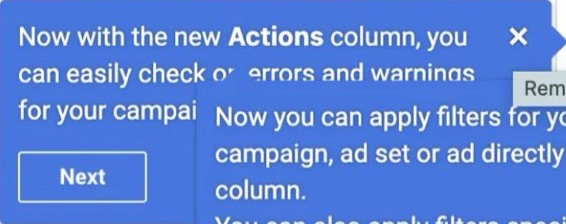

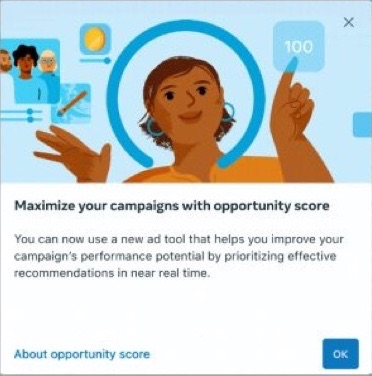
Removing these distracting components on their own increased revenue, which confirmed the problem.
Hypothesis 1: if shared system rules decided when announcements could interrupt, advertisers would dismiss fewer of them.
Hypothesis 2: if an announcement appeared only when an advertiser’s cursor was near its feature, instead of on page load, more would click through to it.
Hypothesis 3: if dismissed announcements went to the notifications tray, advertisers would open them later from there.
Focus
The pile-up had more than one cause. Nothing throttled messages, so they stacked three or more deep. The documentation pointed teams to the wrong patterns, reviews didn’t catch it, and teams shipped their own hardcoded components.
So I started with the underlying system, working with several partners and agreeing on the outcome we needed from each.
With that in place, we could ask harder questions: should this message exist at all, should it interrupt, and by how much? Only high-priority announcements earned the most disruptive pattern, everything else got something quieter, and the smallest updates, like feature improvements or location changes, got nothing at all. New features had to be obvious and intuitive first, instead of leaning on distracting messages as a crutch.
Solution part I
Before redesigning anything, we went after the somewhat easy wins. They didn’t get us to the finish line, but they had to happen before we could go after the more expensive options.
Solution part II
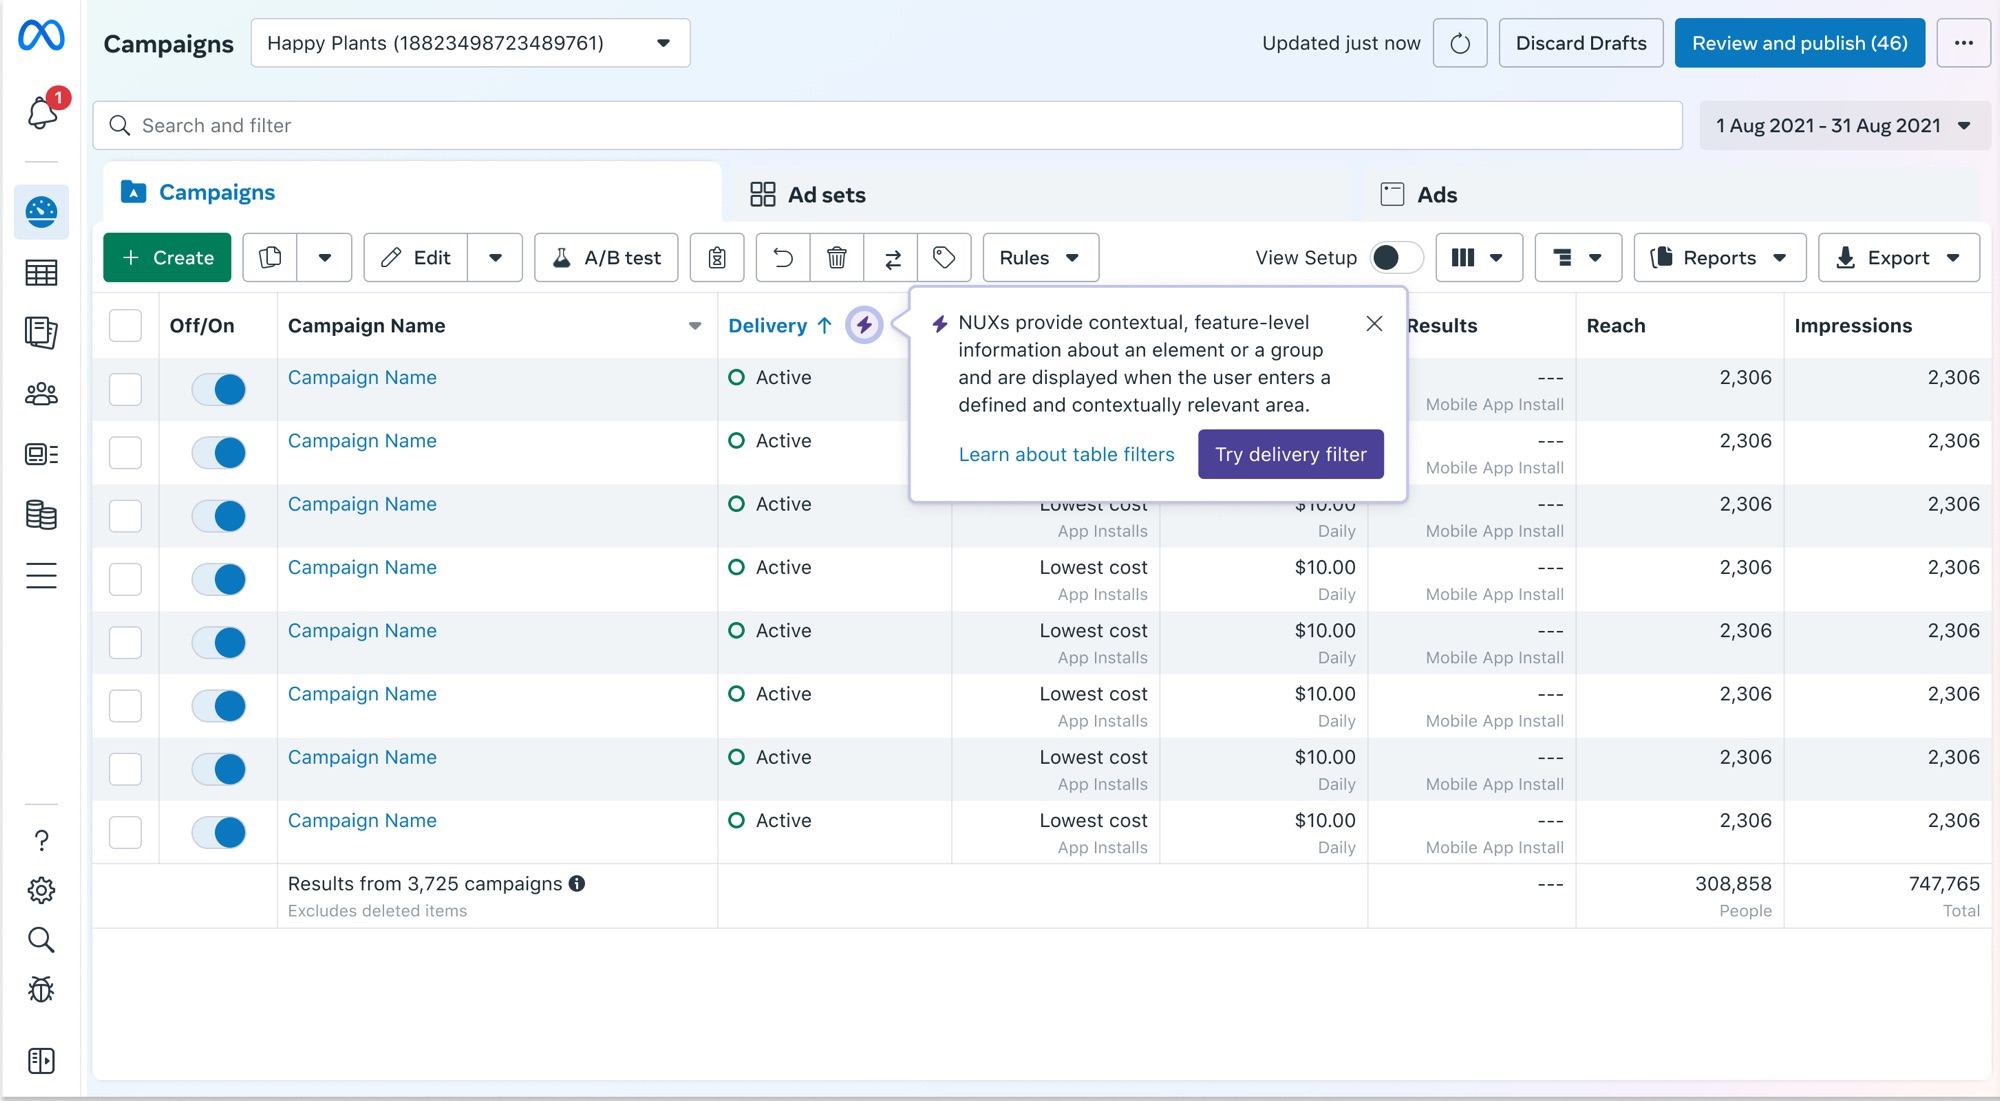
We replaced the blue tooltip with one built on the design system, a no-regrets change that cut the visual shouting. It could flex to meet each team’s needs while staying visually consistent and being vastly more accessible to screen readers.

Compare your results
See how each campaign is doing against its goal, right in the table.
See how each campaign is doing against its goal, right in the table.
For high-priority announcements only, a promo popover replaced the disparate, custom and non-scalable “megaphone” solutions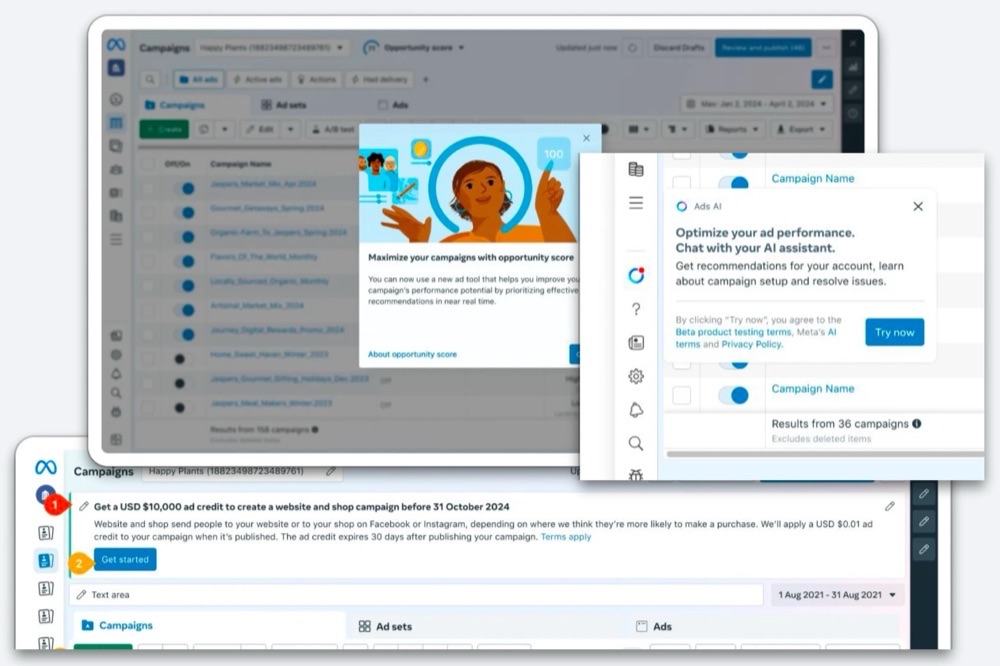 Before: each team built its own way to announce things.. It needed VP sponsorship, and once dismissed, it could be found later instead of reappearing.
The popover menu offers “Show me later”, “Don’t show again” and “Hide all like this”. That gives people control and gives teams a signal for governance.
The popover component and its placement had to work on every Ads Manager surface, such as the main table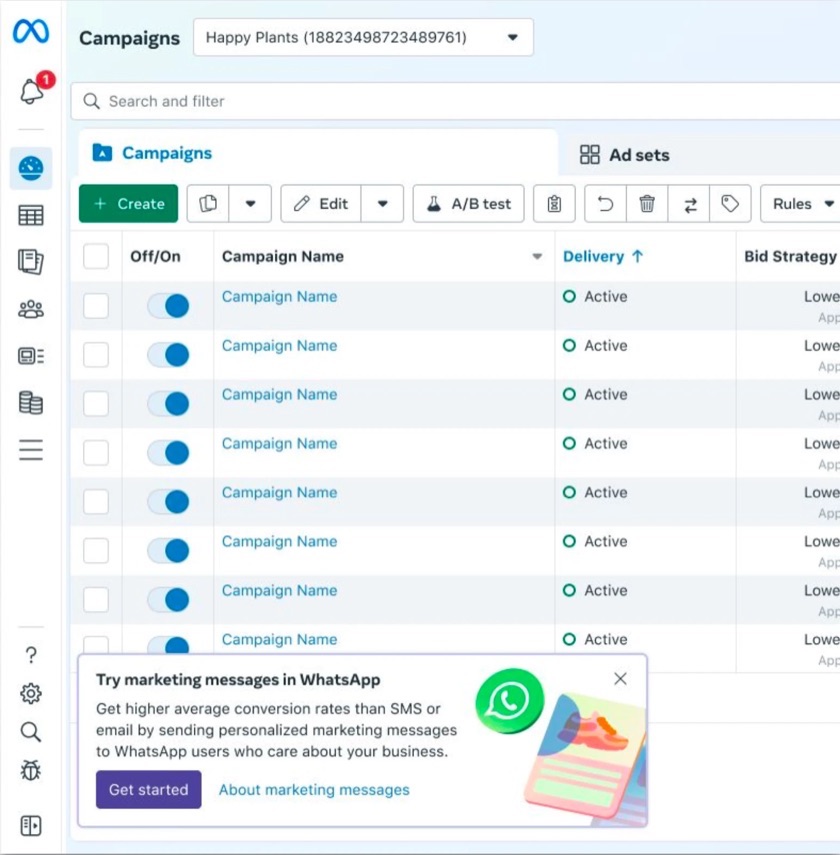 Main table, ad creation
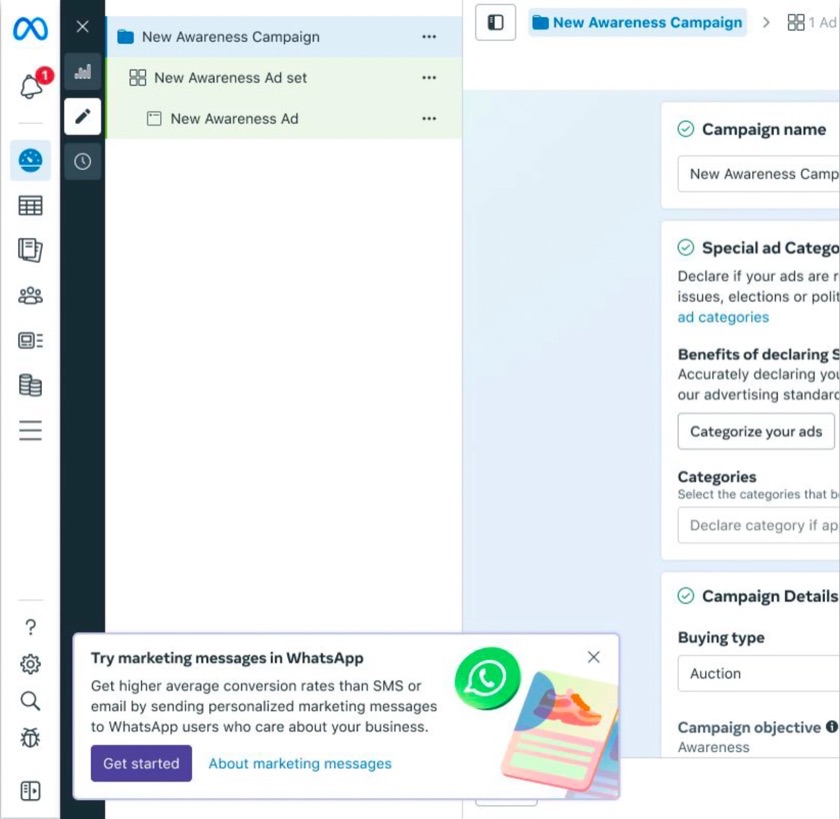 Ad creation and account overview
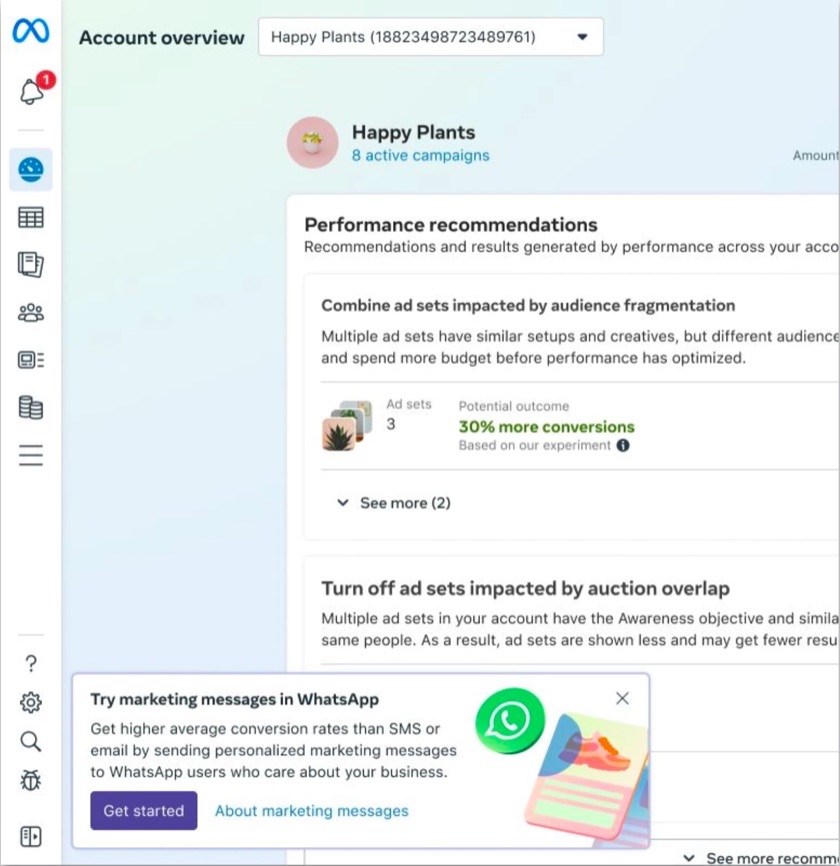 Account overview.
Try marketing messages in WhatsApp
Get higher average conversion rates than SMS or email by sending personalized marketing messages to WhatsApp users who care about your business.
A better component wouldn’t help if every team used it at once, so the components came with rules and limits managed by our dev tools. Limits such as:
Tiers flipped the incentive. Teams now earned reach by proving results, instead of taking it by being the loudest.
Dismissals dropped once the rules were in place, so the first hypothesis held.
“I want to learn about new features and what I can do, but I want to be in the right mode to learn about them. Otherwise, I want them out of my way.”
The basic tooltip fixed how messages looked, and backend fixes to the developer tools ushered teams into picking the right announcement pattern for their needs. But messages still appeared on page load. So we designed a second approach: a message waited for a signal, like how close someone was or what they were using. New search filters, for example, would appear when someone used search, not when the page loaded.
Instead of covering the work, only to be dismissed right away, a small signal sat next to what was new. Moving the cursor to it opened the message, and moving away closed it. We limited this to two hints per page visit, so we didn’t overload people the way the modals had.
In testing, messages that waited for the cursor got more clicks than ones that appeared on page load.
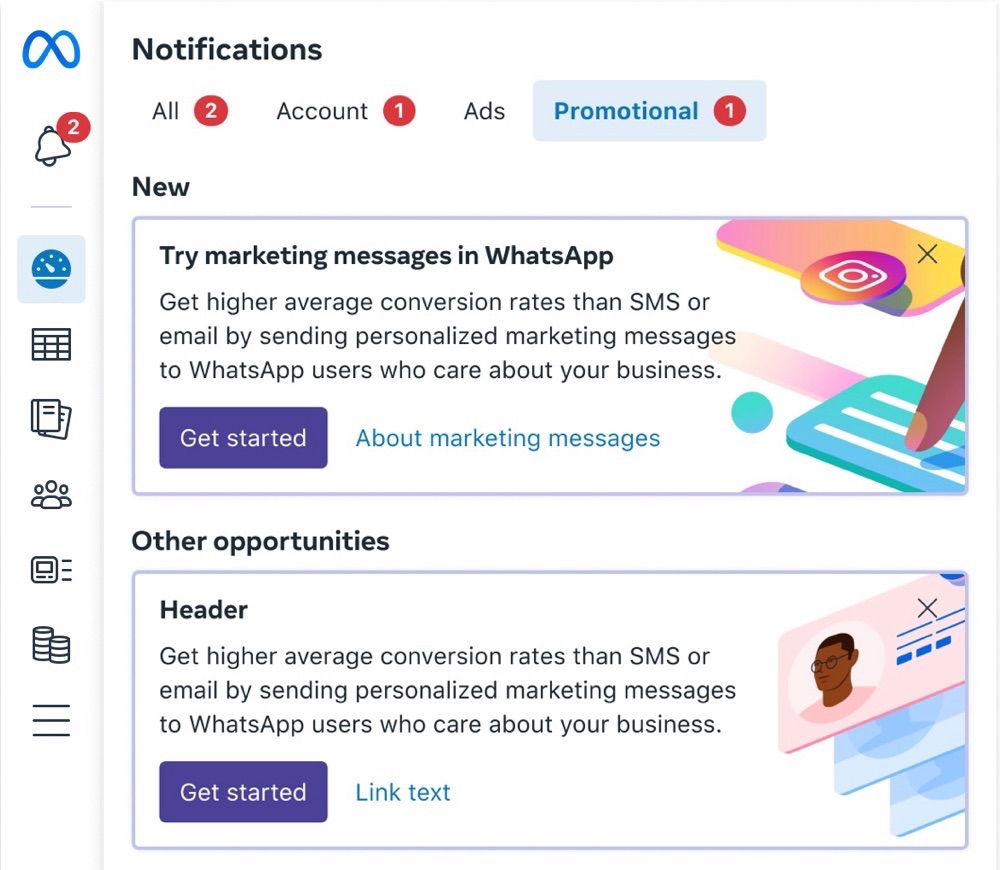
The old tooltip vanished for good once dismissed. Some teams would repeatedly show it, to make up for this. In the new design, closing a promo sent it to the notifications tray, where people could find it again when the time was right. This still respects the user, while the animation educates people and creates habituation on where to find things.
This one is still being measured in the public test.
Conclusion
New components alone wouldn’t have kept messages out of people’s way. What made the change stick was everything around them.
Hard calls
People got stuck in our tools on errors they couldn’t find or fix. My work lifted task completion, projected to recover millions in lost revenue, and became a design system framework.
Outcome
One of 2 product designers, with 2 engineers. I came up with the concept, built the components, and created the animation, which our motion team then approved. The other designer focused on documentation and on adapting our system colors to stay accessible in dark and light mode.
Problem
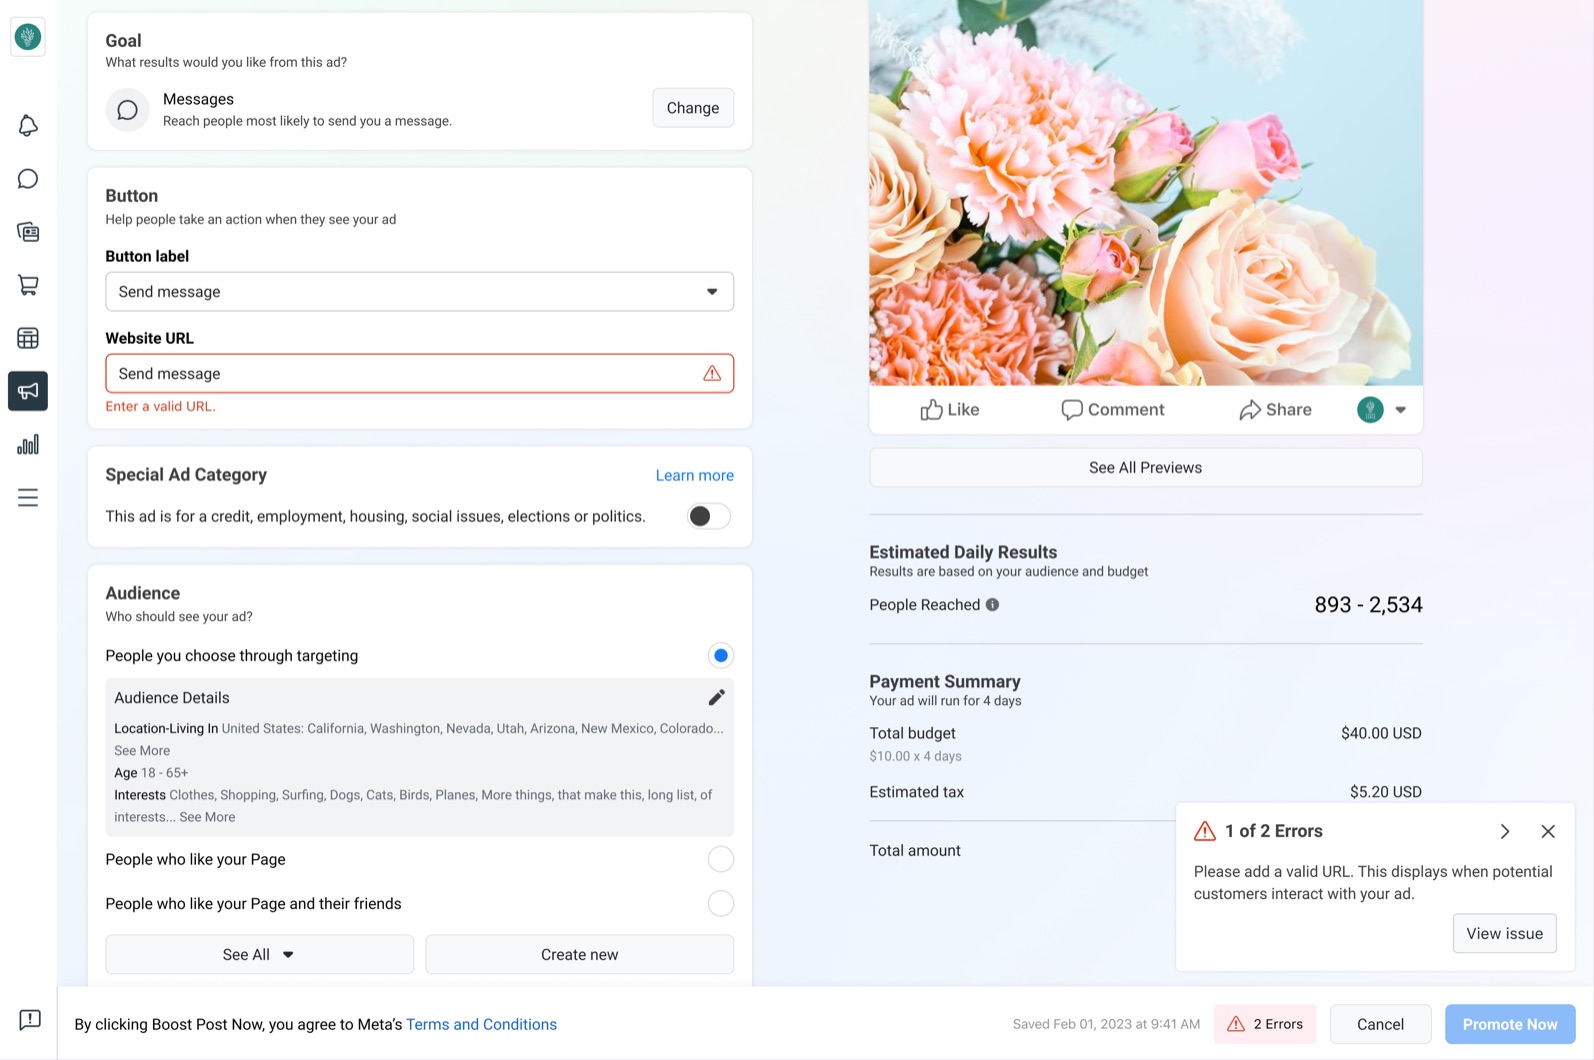
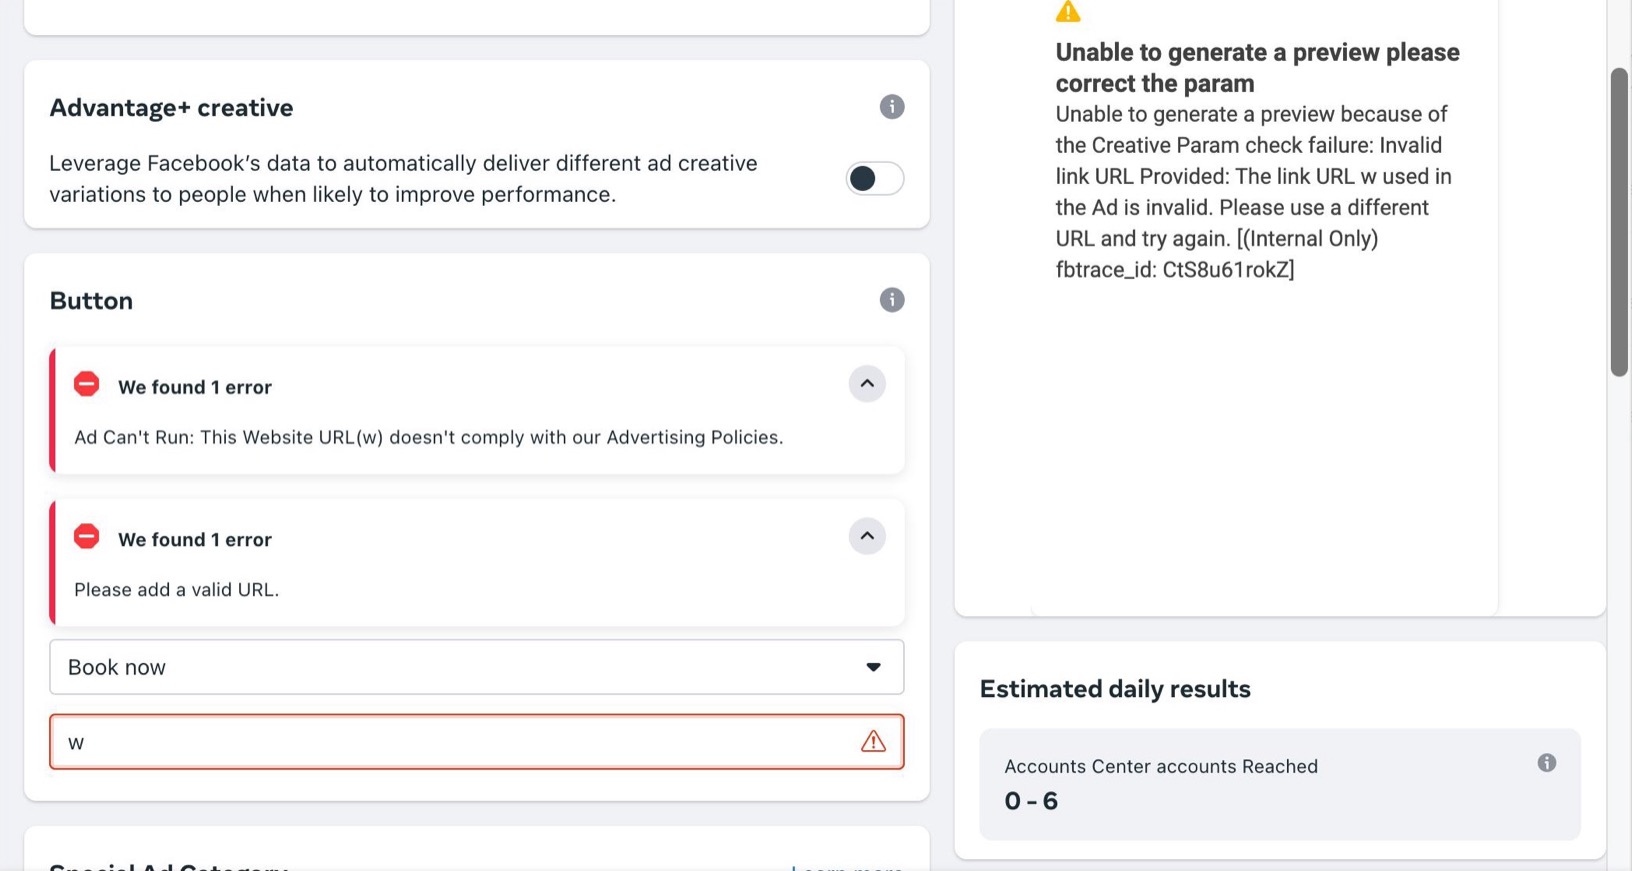
Products built on the same design system still handled errors differently, so people had to work out what had gone wrong and where, sometimes across long, complex creation flows. You couldn’t jump from an error to the field causing it, and nothing drew your eye there. Teams also had no clear guidance on summarizing errors or writing them.
We set out to help teams decide what error to show, how and where, starting with ad creation.
Hypothesis 1: if we took people to the issue blocking them, anywhere on the page and behind collapsed states, and required teams to provide a path to resolve it, more people would recover and complete their task, increasing ad revenue.
Hypothesis 2: if we gave teams a clear framework for which error component to use and where, they would stop building their own patterns, making errors more consistent for people and development faster.
Focus
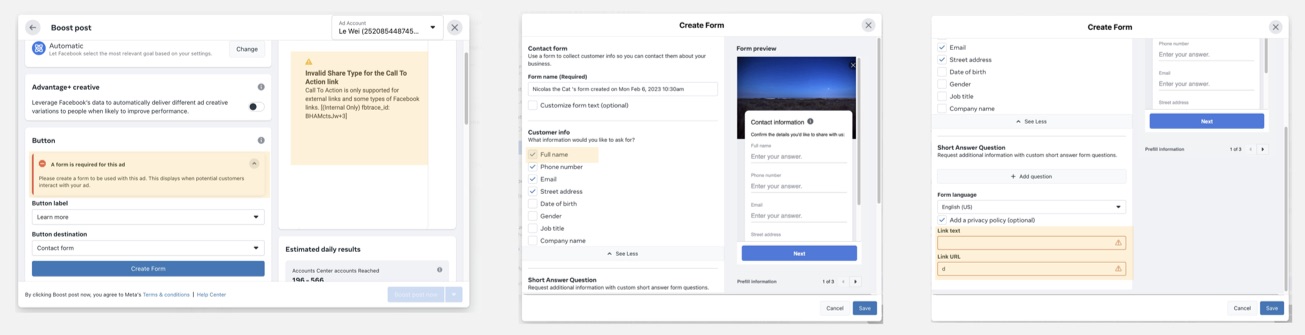
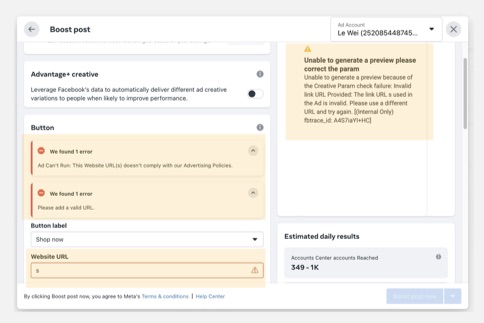
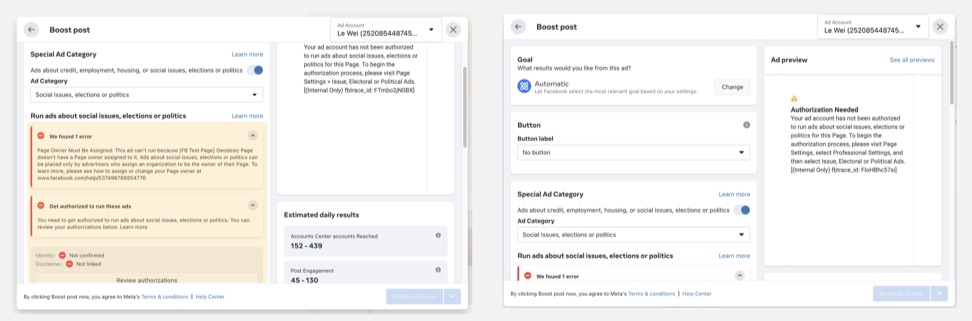
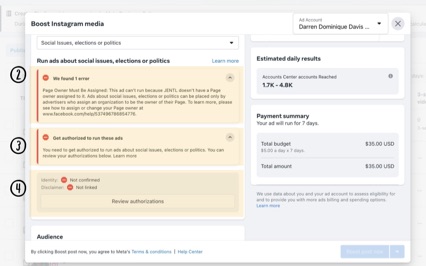
 1
2
3
When people created ads, the top errors made up about two-thirds of all failures. We prioritized by how common and how disruptive an error was, and how many flows our work could improve.
I co-ran a mini design sprint, where we set the principles behind the guidance:
Solution
First, we tackled guidance debt, removing duplicate, outdated and unnecessary backend errors and warnings that were blocking people. After the audit, this was the cheapest and most effective step, and it had to happen before design and engineering time went into new patterns.
What remained were patterns and band-aids that were still failing people.
Creation forms are long, so the field causing an error is often far from where you’re trying to move on. Motion connected where you were stuck to the error’s location on the form.
Guidance cards sat next to the error. They were large and stood out, but people might not be there, so the cards got lost above or below the fold. The central display kept every error in one place you could always see.
Enter a valid URL.
Total budget
$7 total budget minimum. $1 per day for 7 days.
Your minimum spend may not reach enough people. Increase your spend to $30 to ensure a better return.
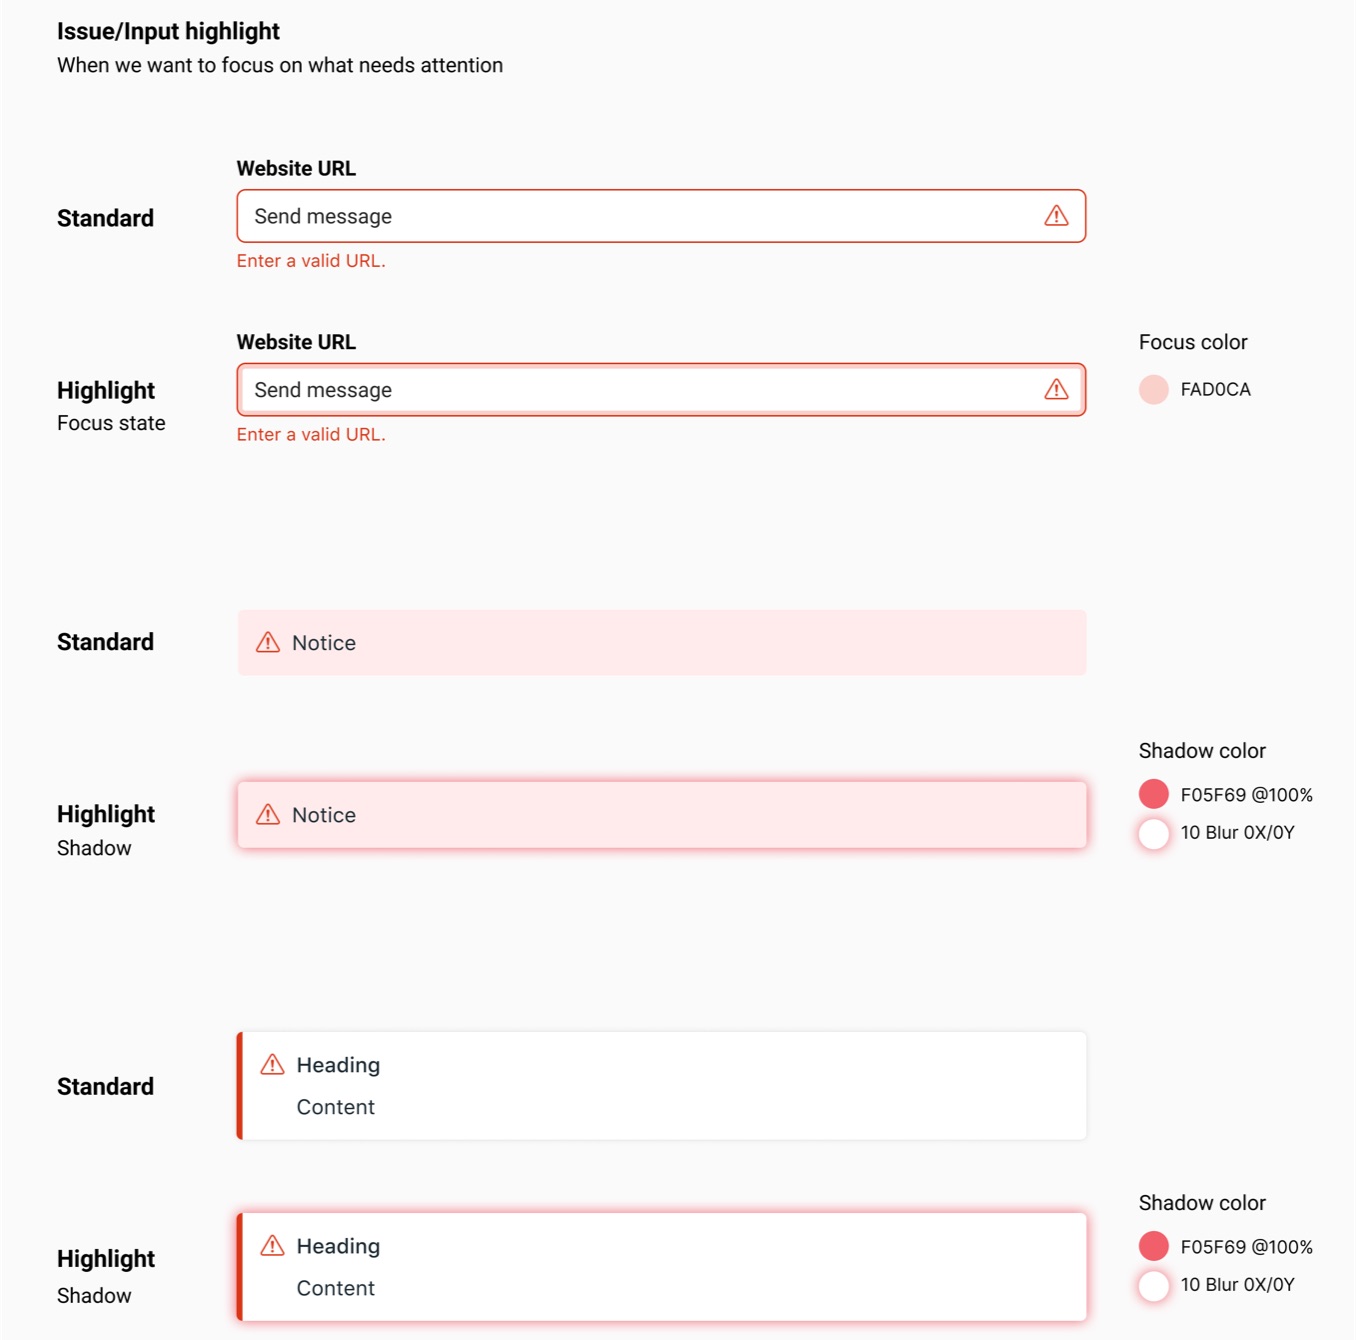
The glow and motion direct your gaze to what needs attention, and the pulse makes them more accessible than color alone.
Conclusion
This success became a framework, built into and referenced in Geodesic, our design system. Teams no longer build their own error patterns, so errors work more consistently across the product and development moves faster. It keeps paying off in ongoing revenue and better support for teams.
We shared a scale to help teams use our components correctly, from a single input up to the whole site. The aim was always the lowest impact and distraction possible. This ran in parallel with the central error display, which connects to these form-level components so people can resolve issues.
A short, direct correction with no links out, like a missing value or an invalid website.
As close to the input as possible. For simple issues: 2 lines max, with a link to learn more or jump elsewhere on the page.
At the top of the section. For simple issues: 2 lines max, with a link to learn more or jump elsewhere on the page.
At the top of the section. For complex issues: more than 2 lines, with an action button that may take you out of the flow.
Stays at the top of the page, because the issue isn’t tied to one section.
Critical issues only, like a blocked account or a failed connection. Very rarely used.
Hard calls
One idea for several issues on a single input was a card that stepped through them one at a time, with a segmented bar showing how many were left. It was too dense, and hard to read, navigate, dismiss and act on. Different errors need different levels of intensity, interruption and action, and it didn’t fit our design system well enough to justify the work, so it didn’t ship.
Dropped concept: several issues on one input. This didn’t ship.